

Dolzarb patternlar

Двойное дно
сформирован 02.04 в 11:00:06 (UTC+0)
сила сигнала 4 из 5
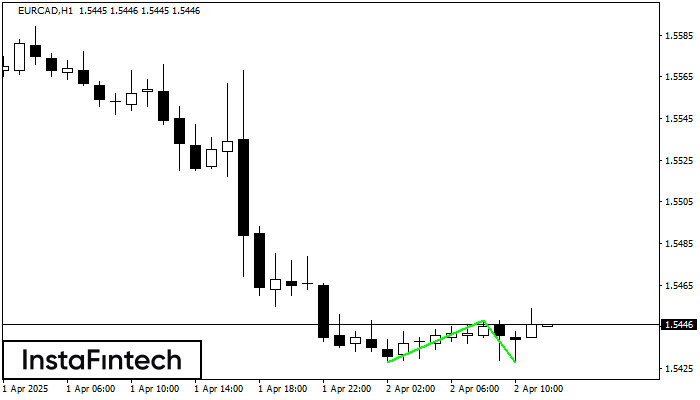
Сформирована фигура «Двойное дно» на графике EURCAD H1. Верхняя граница 1.5448; Нижняя граница 1.5428; Ширина фигуры 20 пунктов. В случае пробоя верхней границы 1.5448 можно будет прогнозировать изменение тенденции, где ширина фигуры и будет являться расстоянием предположительного Тейк Профита.
Shuningdek ko'ring
- Все
- Все
- Bearish Rectangle
- Bearish Symmetrical Triangle
- Bearish Symmetrical Triangle
- Bullish Rectangle
- Double Top
- Double Top
- Triple Bottom
- Triple Bottom
- Triple Top
- Triple Top
- Все
- Все
- Покупка
- Продажа
- Все
- 1
- 2
- 3
- 4
- 5
Bullish Symmetrical Triangle
сформирован 29.04 в 00:01:06 (UTC+0)
сила сигнала 2 из 5
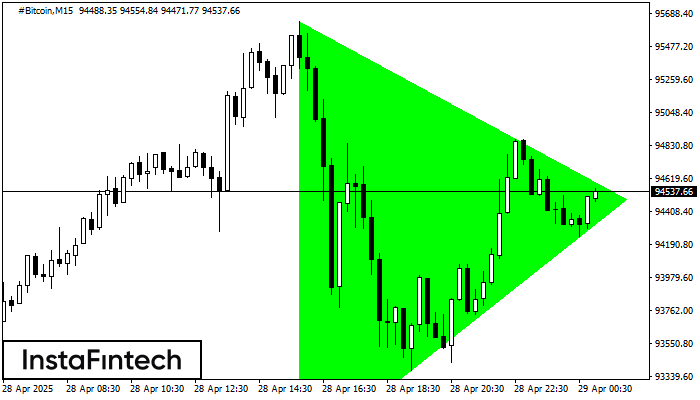
According to the chart of M15, #Bitcoin formed the Bullish Symmetrical Triangle pattern, which signals the trend will continue. Description. The upper border of the pattern touches the coordinates 95636.73/94484.76
The M5 and M15 time frames may have more false entry points.
Открыть график инструмента в новом окне
Double Bottom
сформирован 28.04 в 22:46:00 (UTC+0)
сила сигнала 1 из 5
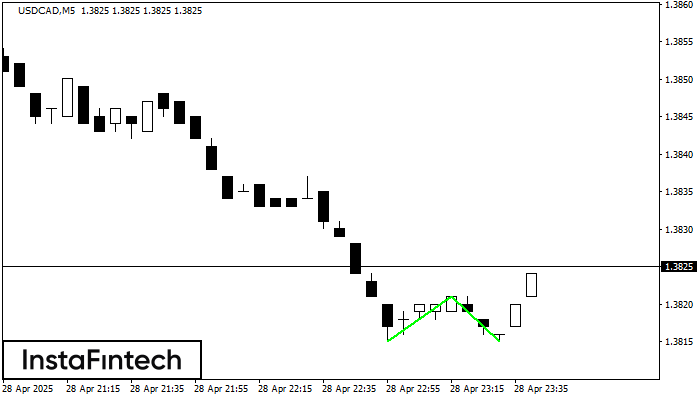
The Double Bottom pattern has been formed on USDCAD M5; the upper boundary is 1.3821; the lower boundary is 1.3815. The width of the pattern is 6 points. In case
The M5 and M15 time frames may have more false entry points.
Открыть график инструмента в новом окне
Triple Bottom
сформирован 28.04 в 22:40:42 (UTC+0)
сила сигнала 1 из 5
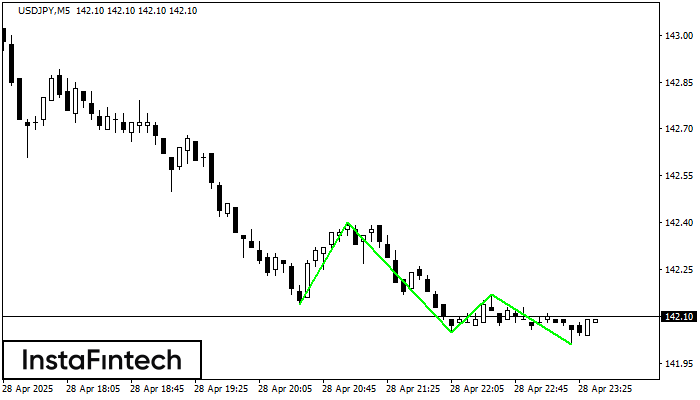
The Triple Bottom pattern has formed on the chart of the USDJPY M5 trading instrument. The pattern signals a change in the trend from downwards to upwards in the case
The M5 and M15 time frames may have more false entry points.
Открыть график инструмента в новом окне


