

Dolzarb patternlar

Двойное дно
сформирован 28.04 в 22:46:00 (UTC+0)
сила сигнала 1 из 5
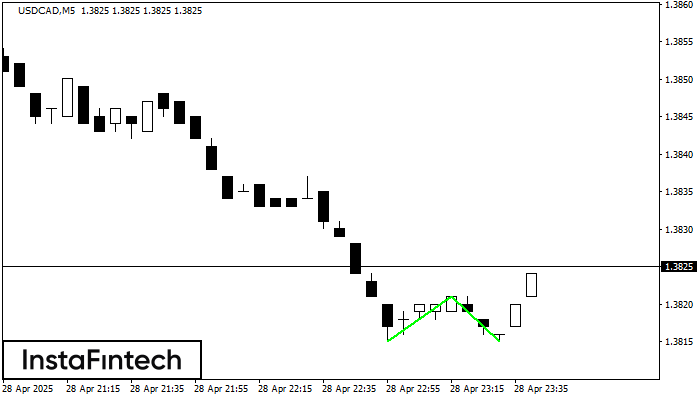
Сформирована фигура «Двойное дно» на графике USDCAD M5. Верхняя граница 1.3821; Нижняя граница 1.3815; Ширина фигуры 6 пунктов. В случае пробоя верхней границы 1.3821 можно будет прогнозировать изменение тенденции, где ширина фигуры и будет являться расстоянием предположительного Тейк Профита.
Таймфреймы М5 и М15 могут иметь больше ложных точек входа.
- Все
- Все
- Bearish Rectangle
- Bearish Symmetrical Triangle
- Bearish Symmetrical Triangle
- Bullish Rectangle
- Double Top
- Double Top
- Triple Bottom
- Triple Bottom
- Triple Top
- Triple Top
- Все
- Все
- Покупка
- Продажа
- Все
- 1
- 2
- 3
- 4
- 5
Bearish Symmetrical Triangle
сформирован 11.06 в 20:01:56 (UTC+0)
сила сигнала 1 из 5
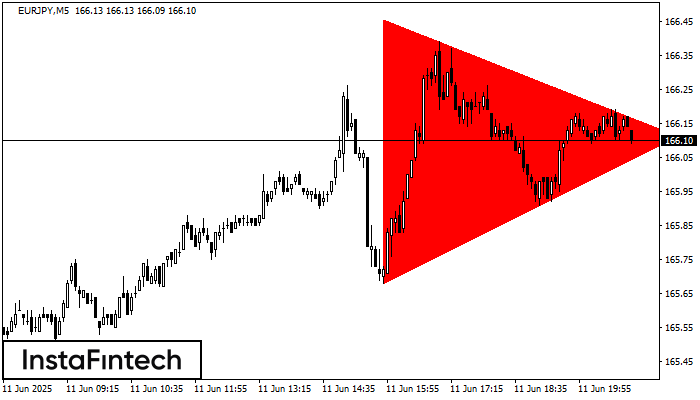
According to the chart of M5, EURJPY formed the Bearish Symmetrical Triangle pattern. Description: The lower border is 165.68/166.11 and upper border is 166.46/166.11. The pattern width is measured
The M5 and M15 time frames may have more false entry points.
Открыть график инструмента в новом окне
Bullish Rectangle
сформирован 11.06 в 19:52:21 (UTC+0)
сила сигнала 2 из 5
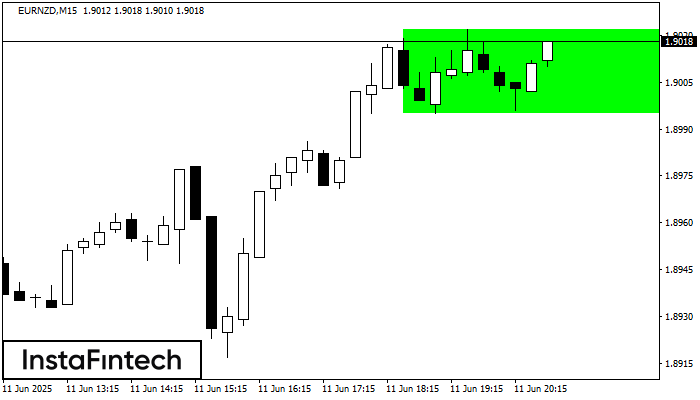
According to the chart of M15, EURNZD formed the Bullish Rectangle. The pattern indicates a trend continuation. The upper border is 1.9022, the lower border is 1.8995. The signal means
The M5 and M15 time frames may have more false entry points.
Открыть график инструмента в новом окне
Triple Bottom
сформирован 11.06 в 19:35:41 (UTC+0)
сила сигнала 1 из 5
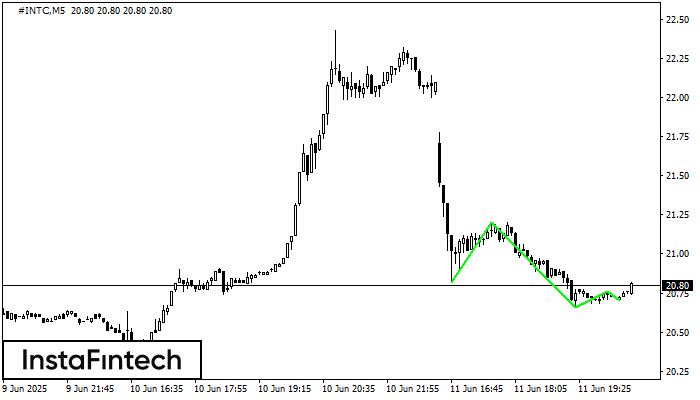
The Triple Bottom pattern has formed on the chart of #INTC M5. Features of the pattern: The lower line of the pattern has coordinates 21.20 with the upper limit 21.20/20.76
The M5 and M15 time frames may have more false entry points.
Открыть график инструмента в новом окне


