

اصل پیٹرن یعنی ایکچوئل پیٹرن

پیٹرن تصویری صورت یعنی گرافکل ماڈلز ہوتے ہیں جو کہ چارٹ میں قیمت کی جانب سے بنتے ہیں جو کہ ٹیکنیکل تجزیات کے امکانات ، ہسٹری {قیمت کے اتار چڑھاو} چونکہ قیمت اپنے آپ کو دہراتی ہے - جس کا مطلب یہ ہے کہ قیمت کا اتار چڑھا یعنی حرکت ایک جیسے حالات میں ہی عموما مختلف ہوتی ہے جو کہ اس بات کو ممکن بناتی ہے قیمت کے مزید رویہ کی پیشن گوئی کی جاسکے جس کا اُسی طرح ہونے کے امکانات خاصے واضح ہوتے ہیں
انسٹا فاریکس کی "ریلی وینٹ" پیٹرنز نامی سروس استعمال میں بہت ہی آسان ہے جو کہ آپ کو مارکیٹ میں ہونے والی تازہ ترین تبدیلیوں کے حوالے باخبر رکھتے ہیں اور مارکیٹ کے ملنے والے اشاروں پر بر وقت در عمل دینے کے قابل کرتے ہیں - ہماری سہولیات سے آپ ہمیشہ پائیں گے تازہ ترین اور سب سے ذیادہ کار آمد انداز یعنی ریلی وینٹ انداز دستیاب ہوں گے- جو کہ کسی بھی پئیر اور ٹائم فریم کے حوالے سے دستیاب ہوں گے
Bearish Symmetrical Triangle
was formed on 27.03 at 03:36:21 (UTC+0)
signal strength 1 of 5
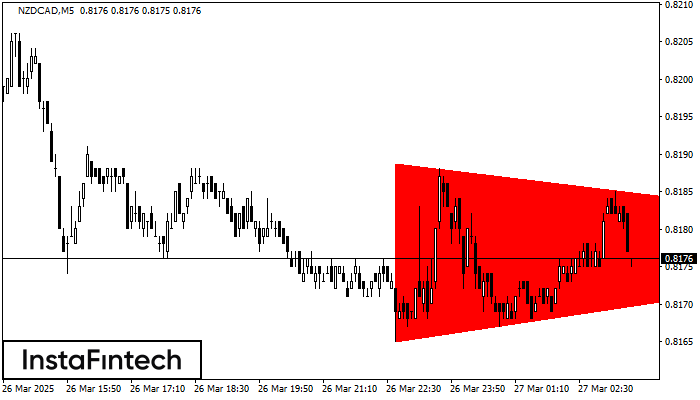
According to the chart of M5, NZDCAD formed the Bearish Symmetrical Triangle pattern. This pattern signals a further downward trend in case the lower border 0.8165 is breached. Here, a hypothetical profit will equal the width of the available pattern that is -24 pips.
The M5 and M15 time frames may have more false entry points.
یہ بھی دیکھیں
- All
- All
- Bearish Rectangle
- Bearish Symmetrical Triangle
- Bearish Symmetrical Triangle
- Bullish Rectangle
- Double Top
- Double Top
- Triple Bottom
- Triple Bottom
- Triple Top
- Triple Top
- All
- All
- Buy
- Sale
- All
- 1
- 2
- 3
- 4
- 5
Triple Bottom
was formed on 08.04 at 15:32:40 (UTC+0)
signal strength 2 of 5
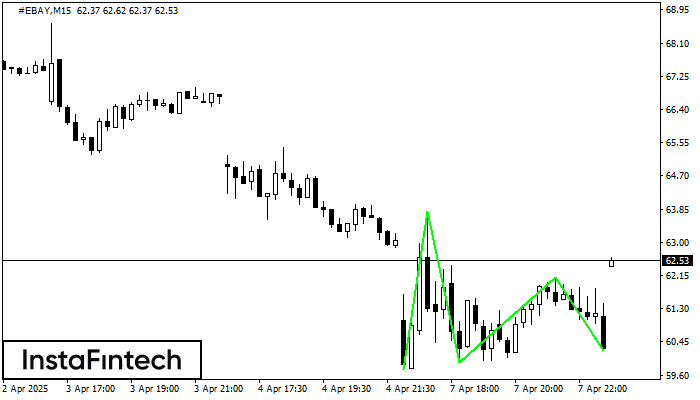
The Triple Bottom pattern has formed on the chart of the #EBAY M15 trading instrument. The pattern signals a change in the trend from downwards to upwards in the case
The M5 and M15 time frames may have more false entry points.
Open chart in a new window
Bearish pennant
was formed on 08.04 at 15:30:28 (UTC+0)
signal strength 4 of 5
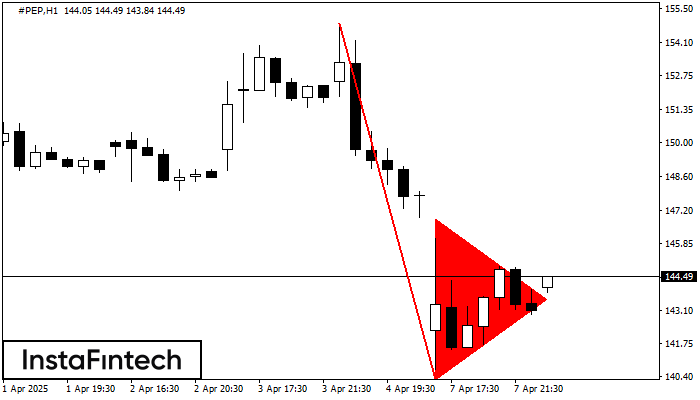
The Bearish pennant pattern has formed on the #PEP H1 chart. The pattern signals continuation of the downtrend in case the pennant’s low of 140.24 is broken through. Recommendations: Place
Open chart in a new window
Bearish pennant
was formed on 08.04 at 15:30:16 (UTC+0)
signal strength 4 of 5
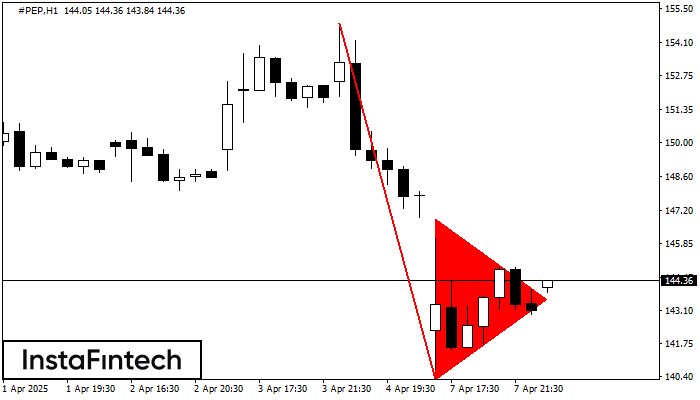
The Bearish pennant pattern has formed on the #PEP H1 chart. This pattern type is characterized by a slight slowdown after which the price will move in the direction
Open chart in a new window


