Actual patterns

Patterns are graphical models which are formed in the chart by the price. According to one of the technical analysis postulates, history (price movement) repeats itself. It means that the price movements are often similar in the same situations which makes it possible to predict the further development of the situation with a high probability.
Relevant patterns by InstaTrade is an easy-to-use service which allows you to be aware of latest changes in the market and react to clues from the market in time. In our service you will always find the latest and most relevant patterns on any pair and any timeframe.
Triple Bottom
was formed on 08.04 at 15:32:40 (UTC+0)
signal strength 2 of 5
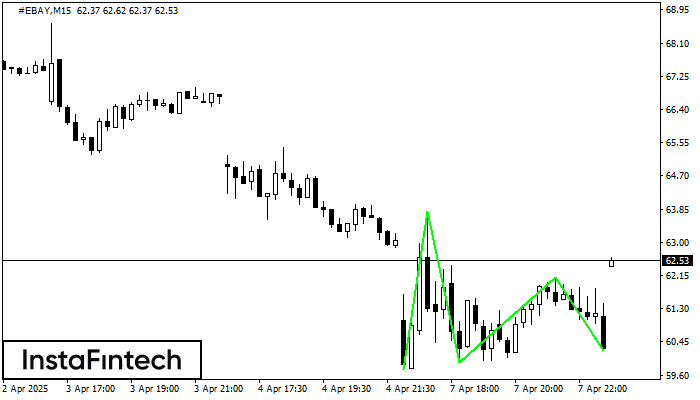
The Triple Bottom pattern has formed on the chart of the #EBAY M15 trading instrument. The pattern signals a change in the trend from downwards to upwards in the case of breakdown of 63.80/62.11.
The M5 and M15 time frames may have more false entry points.
See Also
- All
- All
- Bearish Rectangle
- Bearish Symmetrical Triangle
- Bearish Symmetrical Triangle
- Bullish Rectangle
- Double Top
- Double Top
- Triple Bottom
- Triple Bottom
- Triple Top
- Triple Top
- All
- All
- Buy
- Sale
- All
- 1
- 2
- 3
- 4
- 5
Rectángulo Alcista
was formed on 02.05 at 18:06:10 (UTC+0)
signal strength 1 of 5
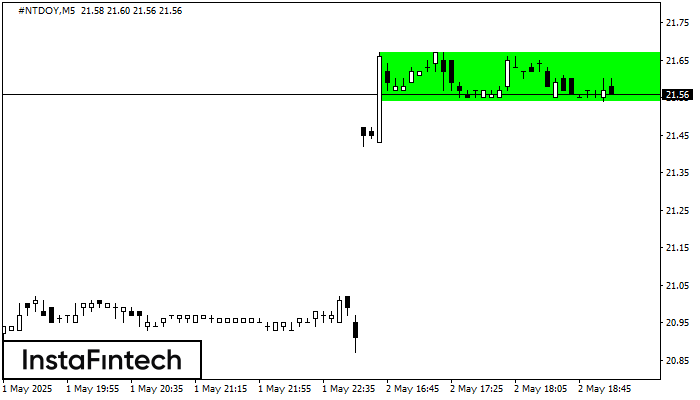
Según el gráfico de M5, #NTDOY formó el Rectángulo Alcista. El patrón indica la continuación de una tendencia. El límite superior es 21.67, el límite inferior es 21.54. La señal
Los marcos de tiempo M5 y M15 pueden tener más puntos de entrada falsos.
Open chart in a new window
Rectángulo Alcista
was formed on 02.05 at 18:06:01 (UTC+0)
signal strength 1 of 5
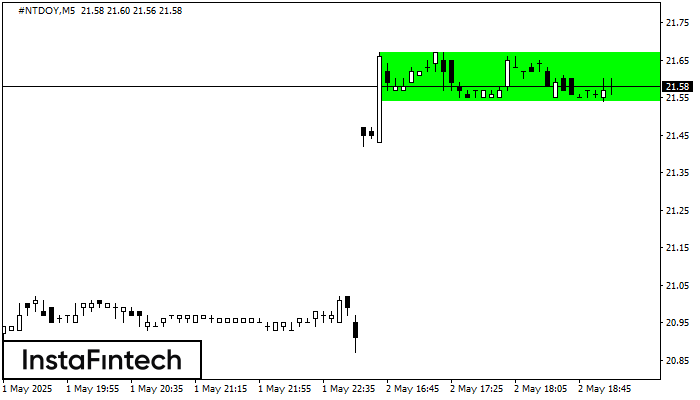
Según el gráfico de M5, #NTDOY formó el Rectángulo Alcista. El patrón indica la continuación de una tendencia. El límite superior es 21.67, el límite inferior es 21.54. La señal
Los marcos de tiempo M5 y M15 pueden tener más puntos de entrada falsos.
Open chart in a new window
Rectángulo Bajista
was formed on 02.05 at 18:02:08 (UTC+0)
signal strength 1 of 5
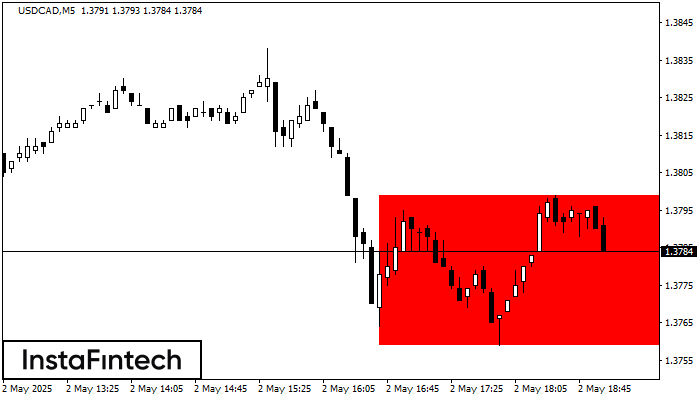
Según el gráfico de M5, USDCAD formó el Rectángulo Bajista. El patrón indica la continuación de una tendencia. El límite superior es 1.3799, el límite inferior es 1.3759. La señal
Los marcos de tiempo M5 y M15 pueden tener más puntos de entrada falsos.
Open chart in a new window