

Corak sebenar

Double Bottom
was formed on 01.04 at 01:05:27 (UTC+0)
signal strength 1 of 5
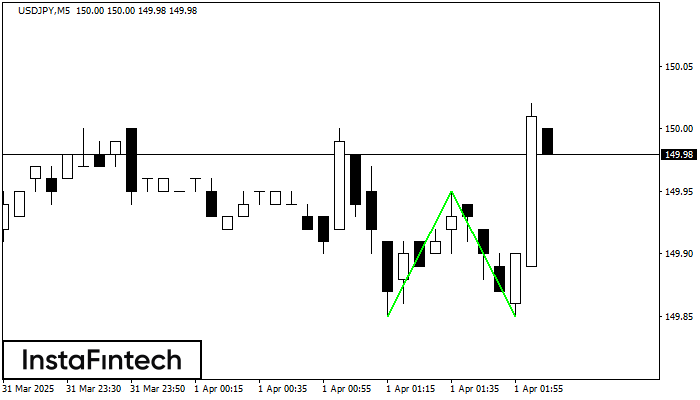
The Double Bottom pattern has been formed on USDJPY M5; the upper boundary is 149.95; the lower boundary is 149.85. The width of the pattern is 10 points. In case of a break of the upper boundary 149.95, a change in the trend can be predicted where the width of the pattern will coincide with the distance to a possible take profit level.
The M5 and M15 time frames may have more false entry points.
- All
- All
- Bearish Rectangle
- Bearish Symmetrical Triangle
- Bearish Symmetrical Triangle
- Bullish Rectangle
- Double Top
- Double Top
- Triple Bottom
- Triple Bottom
- Triple Top
- Triple Top
- All
- All
- Buy
- Sale
- All
- 1
- 2
- 3
- 4
- 5
Triângulo Simétrico de Baixa
was formed on 08.04 at 23:35:37 (UTC+0)
signal strength 1 of 5
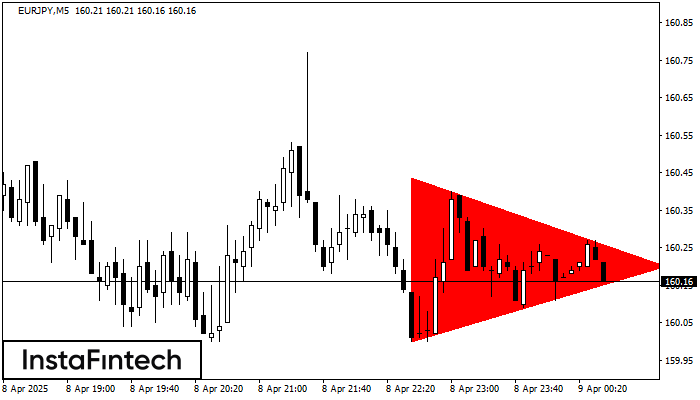
De acordo com o gráfico de M5, EURJPY fomrou o padrão de Triângulo Simétrico de Baixa. Este padrão sinaliza uma nova tendência de baixa se o limite inferior 160.00
Os intervalos M5 e M15 podem ter mais pontos de entrada falsos.
Open chart in a new window
Fundo duplo
was formed on 08.04 at 23:00:01 (UTC+0)
signal strength 1 of 5
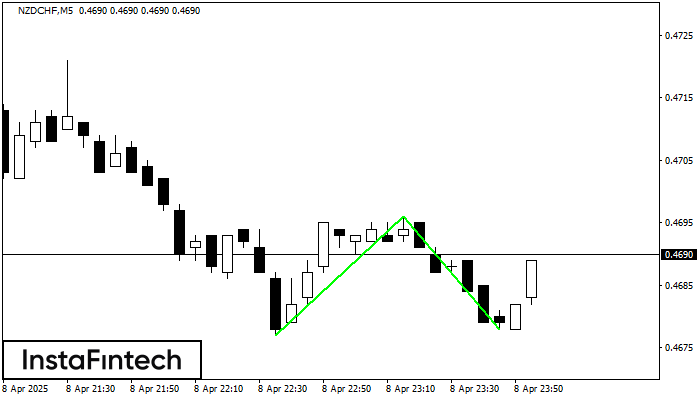
O padrão Fundo duplo foi formado em NZDCHF M5; o limite superior é 0.4696; o limite inferior é 0.4678. A largura do padrão é de 19 pontos. No caso
Os intervalos M5 e M15 podem ter mais pontos de entrada falsos.
Open chart in a new window
Fundo triplo
was formed on 08.04 at 22:55:22 (UTC+0)
signal strength 1 of 5
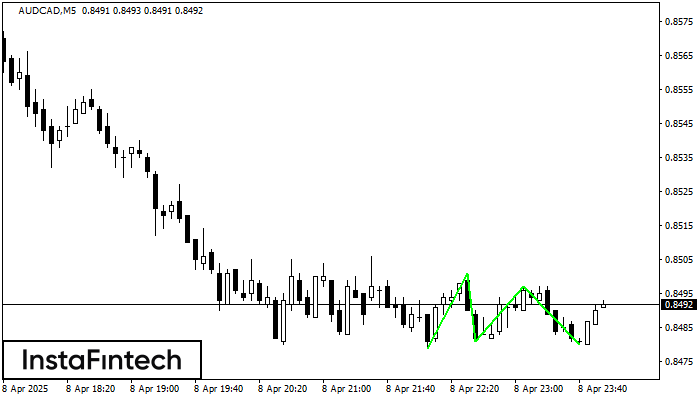
O padrão Fundo triplo foi formado no gráfico de AUDCAD M5. Características do padrão: A linha inferior do padrão tem coordenadas 0.8501 com o limite superior 0.8501/0.8497, a projeção
Os intervalos M5 e M15 podem ter mais pontos de entrada falsos.
Open chart in a new window


