

Padrões atuais

Padrões são modelos gráficos que são formados no gráfico pelo preço. Segundo um dos postulados da análise técnica, a história (movimento de preços) se repete. Isso significa que os movimentos de preços geralmente são semelhantes nas mesmas situações, o que possibilita prever o desenvolvimento futuro da situação com alta probabilidade.
Os padrões relevantes da InstaTrade são um serviço fácil de usar, que permite que você esteja ciente das últimas mudanças no mercado e reaja a indícios do mercado a tempo. Em nosso serviço, você sempre encontrará os padrões mais recentes e relevantes em qualquer par e em qualquer período gráfico.
Triple Bottom
was formed on 08.04 at 22:55:22 (UTC+0)
signal strength 1 of 5
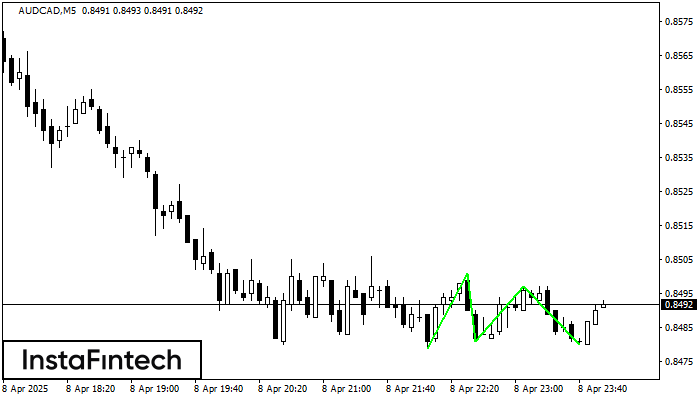
The Triple Bottom pattern has formed on the chart of AUDCAD M5. Features of the pattern: The lower line of the pattern has coordinates 0.8501 with the upper limit 0.8501/0.8497, the projection of the width is 22 points. The formation of the Triple Bottom pattern most likely indicates a change in the trend from downward to upward. This means that in the event of a breakdown of the resistance level 0.8479, the price is most likely to continue the upward movement.
The M5 and M15 time frames may have more false entry points.
- All
- All
- Bearish Rectangle
- Bearish Symmetrical Triangle
- Bearish Symmetrical Triangle
- Bullish Rectangle
- Double Top
- Double Top
- Triple Bottom
- Triple Bottom
- Triple Top
- Triple Top
- All
- All
- Buy
- Sale
- All
- 1
- 2
- 3
- 4
- 5
ডাবল বটম
was formed on 14.05 at 16:50:44 (UTC+0)
signal strength 1 of 5
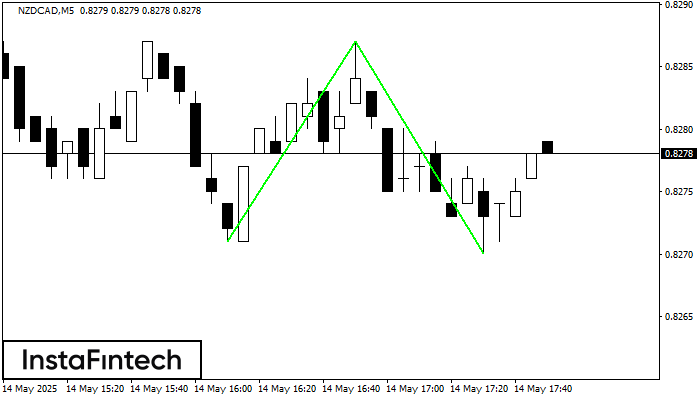
M5 চার্টে, NZDCAD-এর ডাবল বটম প্যাটার্নটি গঠিত হয়েছে। বৈশিষ্ট্য: সাপোর্ট স্তর হচ্ছে 0.8271; রেজিস্ট্যান্স স্তর হচ্ছে 0.8287; প্যাটার্নের প্রস্থ হচ্ছে 16 পয়েন্ট। রেজিস্ট্যান্স স্তর ভেদ করা হলে, 17 পয়েন্টের দূরত্বে
M5 এবং M15 টাইম ফ্রেমে আরও ভুল এন্ট্রি পয়েন্ট থাকতে পারে।
Open chart in a new window
ডাবল বটম
was formed on 14.05 at 16:50:17 (UTC+0)
signal strength 1 of 5
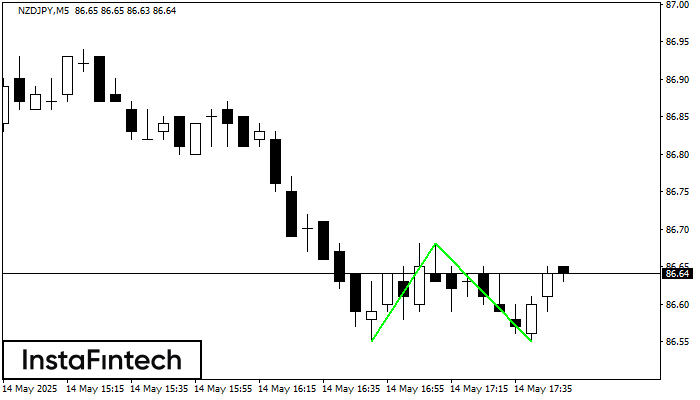
M5 চার্টে, NZDJPY-এর ডাবল বটম প্যাটার্নটি গঠিত হয়েছে। বৈশিষ্ট্য: সাপোর্ট স্তর হচ্ছে 86.55; রেজিস্ট্যান্স স্তর হচ্ছে 86.68; প্যাটার্নের প্রস্থ হচ্ছে 13 পয়েন্ট। রেজিস্ট্যান্স স্তর ভেদ করা হলে, 13 পয়েন্টের দূরত্বে
M5 এবং M15 টাইম ফ্রেমে আরও ভুল এন্ট্রি পয়েন্ট থাকতে পারে।
Open chart in a new window
বিয়ারিশ ফ্ল্যাগ
was formed on 14.05 at 16:32:33 (UTC+0)
signal strength 1 of 5
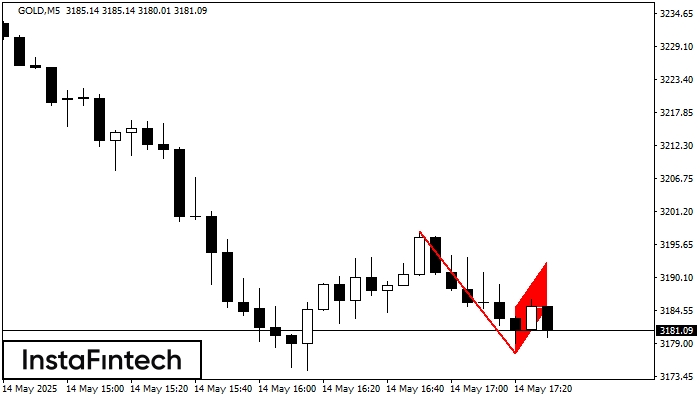
M5 চার্টে GOLD-এর বিয়ারিশ ফ্ল্যাগ প্যাটার্ন গঠিত হয়েছে। এই প্যাটার্নের নীচের সীমানা 3177.35/3185.07 -এ অবস্থিত এবং উপরের সীমানা 3185.27/3192.99-এ অবস্থিত। ফ্ল্যাগপোলের প্রজেকশন হল 2046 পয়েন্ট। এই গঠনটি এই ইঙ্গিত দেয়
M5 এবং M15 টাইম ফ্রেমে আরও ভুল এন্ট্রি পয়েন্ট থাকতে পারে।
Open chart in a new window


