

Өзекті паттерндер

Бычий флаг
сформирован 04.04 в 00:32:16 (UTC+0)
сила сигнала 1 из 5
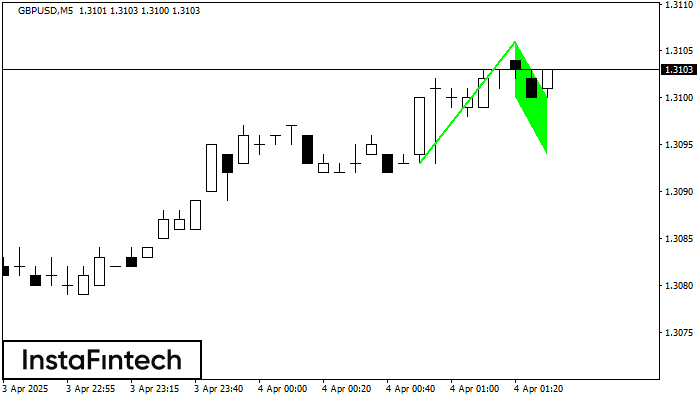
На графике GBPUSD M5 сформировалась фигура «Бычий флаг», которая сигнализирует о продолжении восходящего тренда. Сигналы: Пробой максимума фигуры 1.3106 может привести к продолжению восходящего движения, где рост инструмента будет являться проекцией высоты флагштока.
Таймфреймы М5 и М15 могут иметь больше ложных точек входа.
- Все
- Все
- Bearish Rectangle
- Bearish Symmetrical Triangle
- Bearish Symmetrical Triangle
- Bullish Rectangle
- Double Top
- Double Top
- Triple Bottom
- Triple Bottom
- Triple Top
- Triple Top
- Все
- Все
- Покупка
- Продажа
- Все
- 1
- 2
- 3
- 4
- 5
Bullish pennant
сформирован 24.04 в 16:23:38 (UTC+0)
сила сигнала 1 из 5
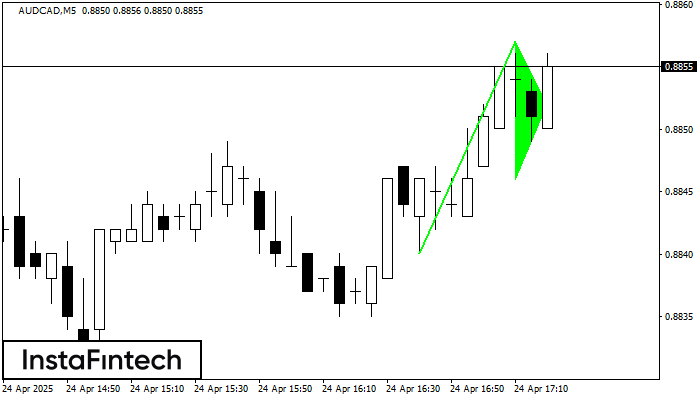
The Bullish pennant signal – Trading instrument AUDCAD M5, continuation pattern. Forecast: it is possible to set up a buy position above the pattern’s high of 0.8857, with the prospect
The M5 and M15 time frames may have more false entry points.
Открыть график инструмента в новом окне
Bullish Symmetrical Triangle
сформирован 24.04 в 16:02:25 (UTC+0)
сила сигнала 1 из 5
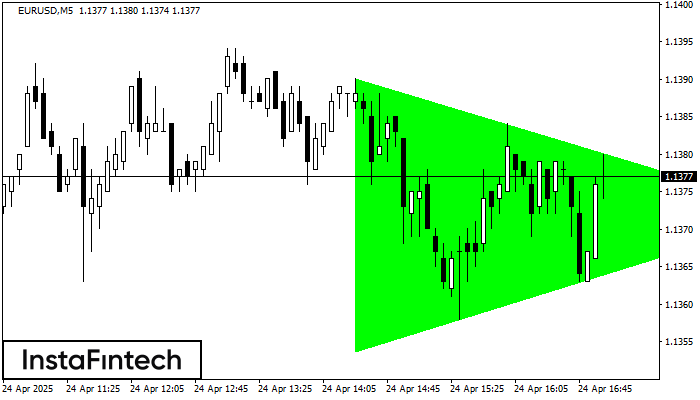
According to the chart of M5, EURUSD formed the Bullish Symmetrical Triangle pattern. Description: This is the pattern of a trend continuation. 1.1390 and 1.1354 are the coordinates
The M5 and M15 time frames may have more false entry points.
Открыть график инструмента в новом окне
Bullish Rectangle
сформирован 24.04 в 16:01:14 (UTC+0)
сила сигнала 2 из 5
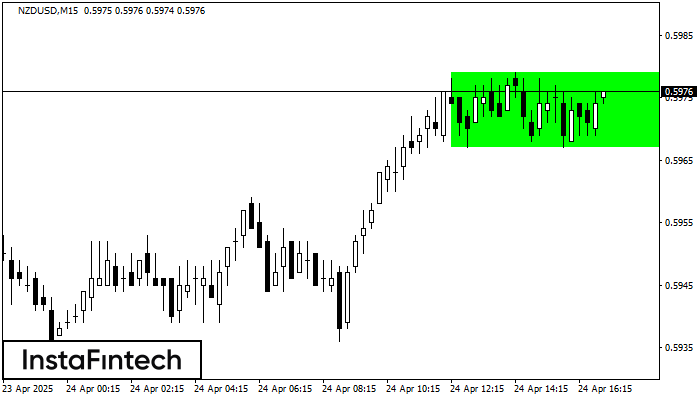
According to the chart of M15, NZDUSD formed the Bullish Rectangle. The pattern indicates a trend continuation. The upper border is 0.5979, the lower border is 0.5967. The signal means
The M5 and M15 time frames may have more false entry points.
Открыть график инструмента в новом окне


