

Өзекті паттерндер

Бычий вымпел
сформирован 24.04 в 16:23:38 (UTC+0)
сила сигнала 1 из 5
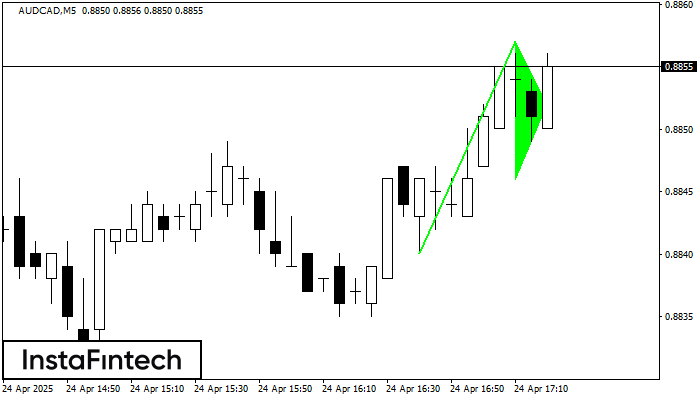
Сигнал «Бычий вымпел» – Торговый инструмент AUDCAD M5, фигура продолжения тенденции. Прогноз: позицию на покупку можно открывать выше максимума фигуры 0.8857, где перспектива будущего хода будет являться проекцией высоты флагштока.
Таймфреймы М5 и М15 могут иметь больше ложных точек входа.
- Все
- Все
- Bearish Rectangle
- Bearish Symmetrical Triangle
- Bearish Symmetrical Triangle
- Bullish Rectangle
- Double Top
- Double Top
- Triple Bottom
- Triple Bottom
- Triple Top
- Triple Top
- Все
- Все
- Покупка
- Продажа
- Все
- 1
- 2
- 3
- 4
- 5
Double Bottom
was formed on 12.05 at 21:26:19 (UTC+0)
signal strength 1 of 5
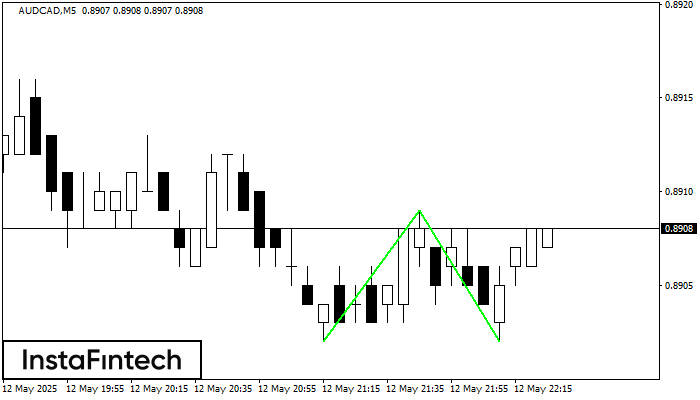
The Double Bottom pattern has been formed on AUDCAD M5; the upper boundary is 0.8909; the lower boundary is 0.8902. The width of the pattern is 7 points. In case
The M5 and M15 time frames may have more false entry points.
Open chart in a new window
Triple Top
was formed on 12.05 at 21:25:14 (UTC+0)
signal strength 1 of 5
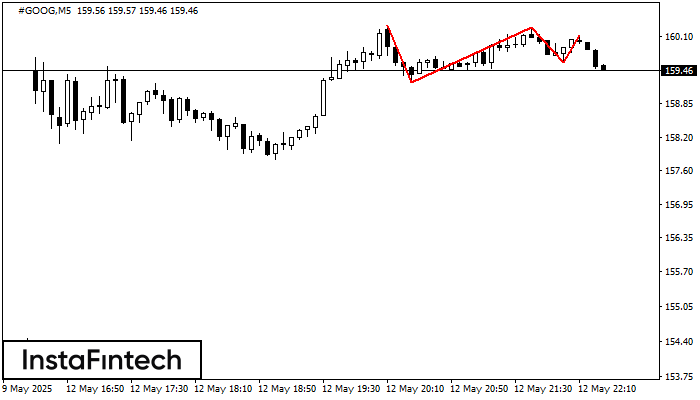
The Triple Top pattern has formed on the chart of the #GOOG M5. Features of the pattern: borders have an ascending angle; the lower line of the pattern
The M5 and M15 time frames may have more false entry points.
Open chart in a new window
Bullish Rectangle
was formed on 12.05 at 21:18:10 (UTC+0)
signal strength 1 of 5
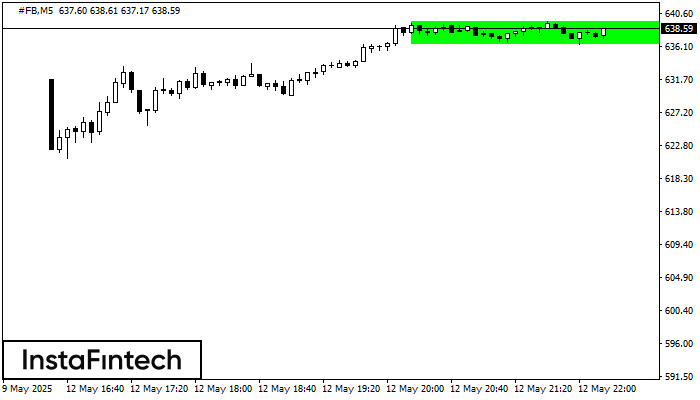
According to the chart of M5, #FB formed the Bullish Rectangle. The pattern indicates a trend continuation. The upper border is 639.49, the lower border is 636.48. The signal means
The M5 and M15 time frames may have more false entry points.
Open chart in a new window


