

Өзекті паттерндер

Прямоугольник
сформирован 26.03 в 21:30:27 (UTC+0)
сила сигнала 1 из 5
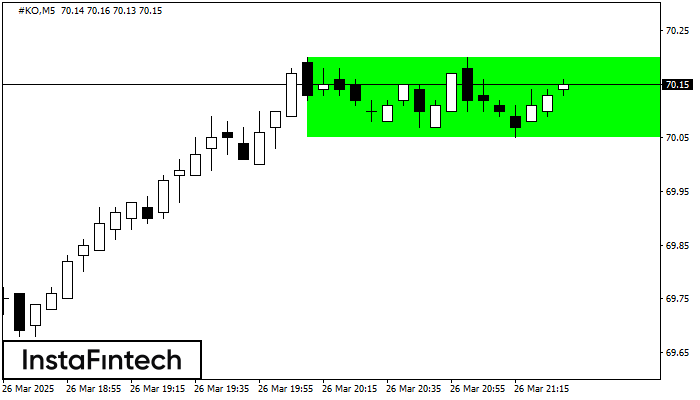
По #KO на M5 сформировалась фигура «Прямоугольник». Фигура данного типа относится к тому типу продолжения тренда, который содержит в себе два уровня: Сопротивление 70.20; Поддержка 70.05. В случае пробоя уровня сопротивления 70.20 возможно дальнейшее восходящее движение.
Таймфреймы М5 и М15 могут иметь больше ложных точек входа.
Сондай-ақ қараңыз
- Все
- Все
- Bearish Rectangle
- Bearish Symmetrical Triangle
- Bearish Symmetrical Triangle
- Bullish Rectangle
- Double Top
- Double Top
- Triple Bottom
- Triple Bottom
- Triple Top
- Triple Top
- Все
- Все
- Покупка
- Продажа
- Все
- 1
- 2
- 3
- 4
- 5
Bearish Rectangle
was formed on 10.04 at 07:36:01 (UTC+0)
signal strength 1 of 5
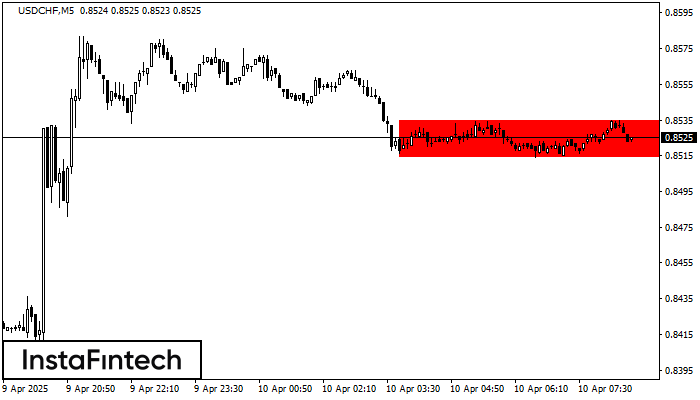
According to the chart of M5, USDCHF formed the Bearish Rectangle which is a pattern of a trend continuation. The pattern is contained within the following borders: lower border 0.8514
The M5 and M15 time frames may have more false entry points.
Open chart in a new window
Double Bottom
was formed on 10.04 at 07:30:31 (UTC+0)
signal strength 1 of 5
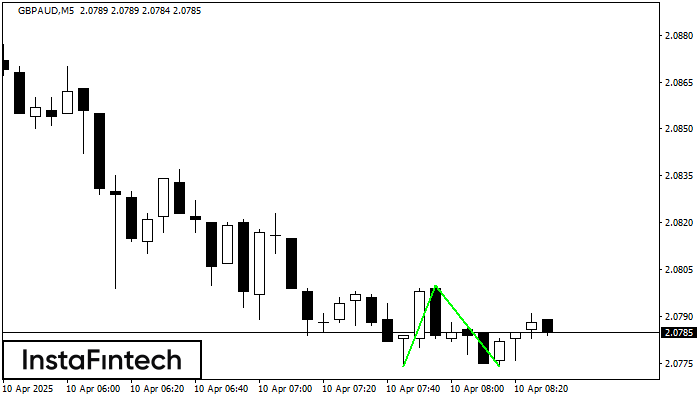
The Double Bottom pattern has been formed on GBPAUD M5; the upper boundary is 2.0800; the lower boundary is 2.0774. The width of the pattern is 26 points. In case
The M5 and M15 time frames may have more false entry points.
Open chart in a new window
Triple Top
was formed on 10.04 at 07:30:29 (UTC+0)
signal strength 1 of 5
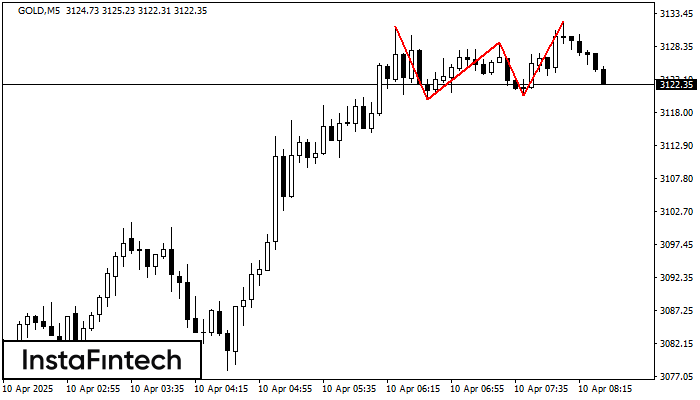
The Triple Top pattern has formed on the chart of the GOLD M5 trading instrument. It is a reversal pattern featuring the following characteristics: resistance level -65, support level -55
The M5 and M15 time frames may have more false entry points.
Open chart in a new window


