

النماذج الفعلية

النماذج هي نماذج رسومية تتشكل في الرسم البياني حسب السعر. وفقا لأحد المسلمات التحليلية الفنية، فإن التاريخ (حركة السعر) يكرر نفسه. ويعني ذلك أن حركات الأسعار غالباً ما تكون متشابهة في نفس الأوضاع مما يجعل من الممكن التنبؤ بزيادة تطوير الوضع الذي يتسم باحتمال كبير.
النماذج ذات الصلة المقدمة من قبل إنستافوركس هي خدمة سهلة الاستخدام تسمح لك بمعرفة التغييرات الأخيرة في السوق والرد على الأدلة من السوق في الوقت المناسب. في خدمتنا، ستجد دائمًا النماذج الأكثر حداثة وملاءمة في أي زوج وأي إطار زمني.
Double Bottom
was formed on 10.04 at 07:30:31 (UTC+0)
signal strength 1 of 5
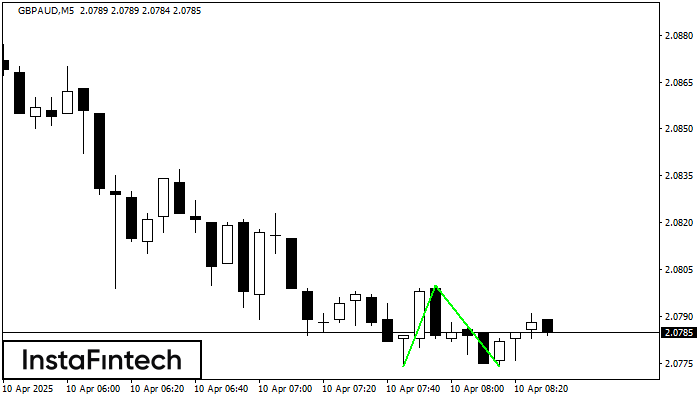
The Double Bottom pattern has been formed on GBPAUD M5; the upper boundary is 2.0800; the lower boundary is 2.0774. The width of the pattern is 26 points. In case of a break of the upper boundary 2.0800, a change in the trend can be predicted where the width of the pattern will coincide with the distance to a possible take profit level.
The M5 and M15 time frames may have more false entry points.
- All
- All
- Bearish Rectangle
- Bearish Symmetrical Triangle
- Bearish Symmetrical Triangle
- Bullish Rectangle
- Double Top
- Double Top
- Triple Bottom
- Triple Bottom
- Triple Top
- Triple Top
- All
- All
- Buy
- Sale
- All
- 1
- 2
- 3
- 4
- 5
Teratas Ganda
was formed on 05.05 at 13:35:02 (UTC+0)
signal strength 1 of 5
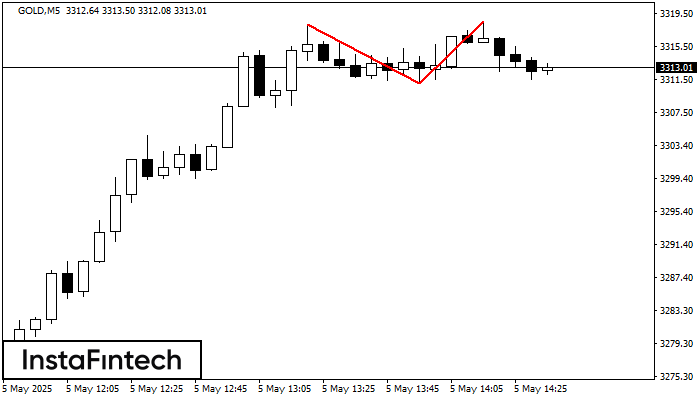
Pola reversal Teratas Ganda telah terbentuk pada GOLD M5. Karakteristik: batas atas 3318.18; batas bawah 3311.06; lebar pola 746 poin. Transaksi jual lebih baik dibuka di bawah batas bawah 3311.06
Rangka waktu M5 dan M15 mungkin memiliki lebih dari titik entri yang keliru.
Open chart in a new window
Bawah Ganda
was formed on 05.05 at 13:00:02 (UTC+0)
signal strength 2 of 5
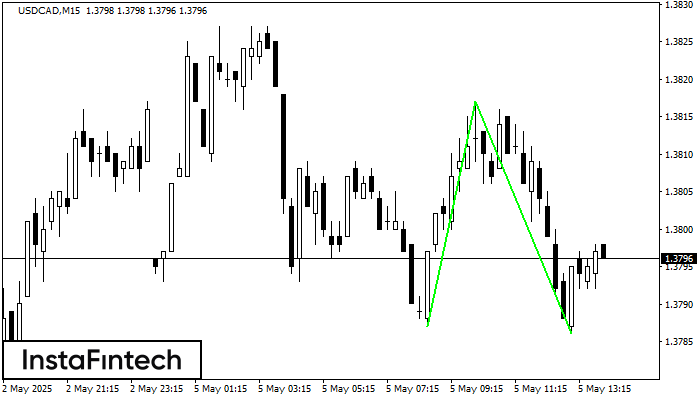
Pola Bawah Ganda telah terbentuk pada USDCAD M15; batas atas di 1.3817; batas bawah di 1.3786. Lebar pola sebesar 30 poin. Jika harga menembus batas atas 1.3817, Perubahan dalam tren
Rangka waktu M5 dan M15 mungkin memiliki lebih dari titik entri yang keliru.
Open chart in a new window
Bawah Ganda
was formed on 05.05 at 12:20:14 (UTC+0)
signal strength 1 of 5
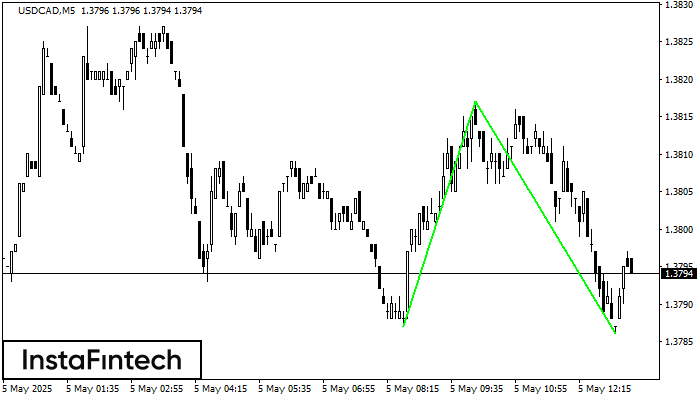
Pola Bawah Ganda telah terbentuk pada USDCAD M5; batas atas di 1.3817; batas bawah di 1.3786. Lebar pola sebesar 30 poin. Jika harga menembus batas atas 1.3817, Perubahan dalam tren
Rangka waktu M5 dan M15 mungkin memiliki lebih dari titik entri yang keliru.
Open chart in a new window


