

Pola sebenarnya

Double Top
was formed on 03.04 at 09:29:55 (UTC+0)
signal strength 3 of 5
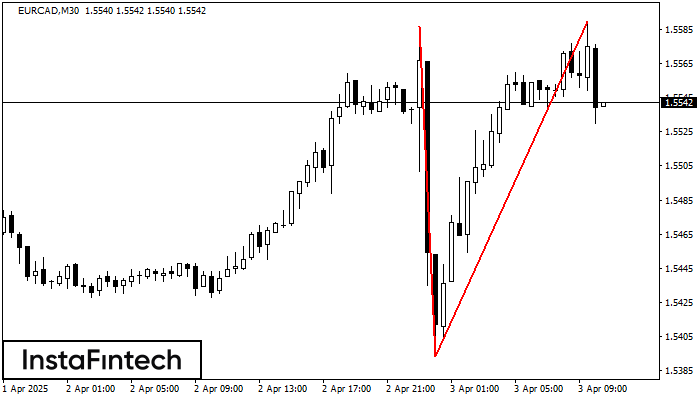
On the chart of EURCAD M30 the Double Top reversal pattern has been formed. Characteristics: the upper boundary 1.5590; the lower boundary 1.5393; the width of the pattern 197 points. The signal: a break of the lower boundary will cause continuation of the downward trend targeting the 1.5363 level.
- All
- All
- Bearish Rectangle
- Bearish Symmetrical Triangle
- Bearish Symmetrical Triangle
- Bullish Rectangle
- Double Top
- Double Top
- Triple Bottom
- Triple Bottom
- Triple Top
- Triple Top
- All
- All
- Buy
- Sale
- All
- 1
- 2
- 3
- 4
- 5
Kepala dan Bahu Terbalik
was formed on 21.04 at 21:45:32 (UTC+0)
signal strength 2 of 5

Menurut grafik dari M15, #FB membentuk pola Kepala dan Bahu Terbalik. Puncak kepala (Head) ditetapkan di 485.03 sementara garis median leher (Neck) ditemukan di 479.95/482.45. Formasi pola Kepala dan Bahu
Rangka waktu M5 dan M15 mungkin memiliki lebih dari titik entri yang keliru.
Open chart in a new window
Panji Bearish
was formed on 21.04 at 21:30:29 (UTC+0)
signal strength 4 of 5

Pola Panji Bearish telah terbentuk di grafik #FB H1. Jenis pola ini memiliki ciri sedikit perlambatan yang setelahnya harga akan bergerak ke arah tren sebenarnya. Jika harga ditetapkan di bawah
Open chart in a new window
Bawah Triple
was formed on 21.04 at 21:30:21 (UTC+0)
signal strength 2 of 5

Pola Bawah Triple telah terbentuk pada #AAPL M15. Pola tersebut memiliki karakteristik sebagai berikut: level resistance 191.73/191.10; level support 189.80/190.18; dengan lebar 193 poin. Jika terjadi pemecahan (breakdown) pada level
Rangka waktu M5 dan M15 mungkin memiliki lebih dari titik entri yang keliru.
Open chart in a new window


