

Pola sebenarnya

Inverse Head and Shoulder
was formed on 21.04 at 21:45:32 (UTC+0)
signal strength 2 of 5

According to the chart of M15, #FB formed the Inverse Head and Shoulder pattern. The Head’s top is set at 485.03 while the median line of the Neck is found at 479.95/482.45. The formation of the Inverse Head and Shoulder pattern evidently signals a reversal of the downward trend. In other words, in case the scenario comes true, the price of #FB will go towards 485.26
The M5 and M15 time frames may have more false entry points.
- All
- All
- Bearish Rectangle
- Bearish Symmetrical Triangle
- Bearish Symmetrical Triangle
- Bullish Rectangle
- Double Top
- Double Top
- Triple Bottom
- Triple Bottom
- Triple Top
- Triple Top
- All
- All
- Buy
- Sale
- All
- 1
- 2
- 3
- 4
- 5
Bullish Rectangle
was formed on 05.05 at 14:01:01 (UTC+0)
signal strength 1 of 5
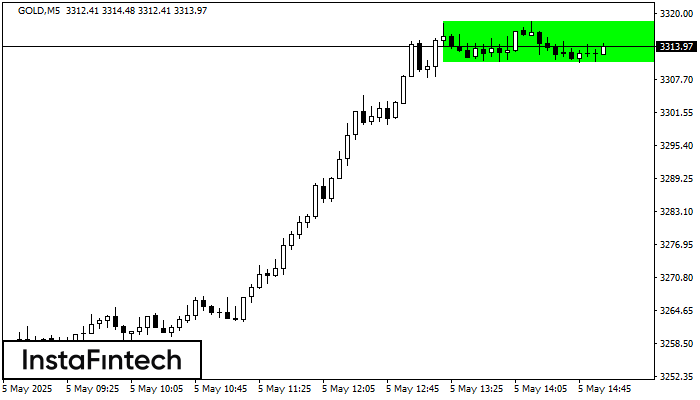
According to the chart of M5, GOLD formed the Bullish Rectangle which is a pattern of a trend continuation. The pattern is contained within the following borders: the lower border
The M5 and M15 time frames may have more false entry points.
Open chart in a new window
Double Top
was formed on 05.05 at 13:35:02 (UTC+0)
signal strength 1 of 5
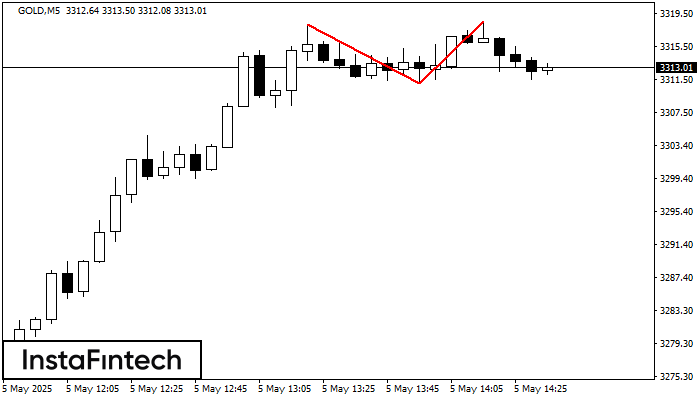
The Double Top reversal pattern has been formed on GOLD M5. Characteristics: the upper boundary 3318.18; the lower boundary 3311.06; the width of the pattern is 746 points. Sell trades
The M5 and M15 time frames may have more false entry points.
Open chart in a new window
Double Bottom
was formed on 05.05 at 13:00:02 (UTC+0)
signal strength 2 of 5
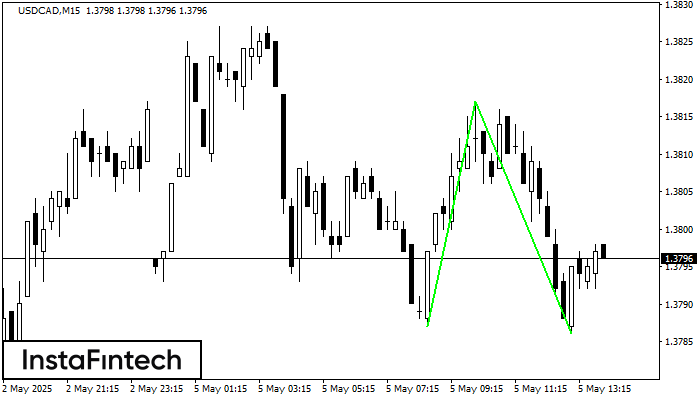
The Double Bottom pattern has been formed on USDCAD M15; the upper boundary is 1.3817; the lower boundary is 1.3786. The width of the pattern is 30 points. In case
The M5 and M15 time frames may have more false entry points.
Open chart in a new window


