

Pola sebenarnya

Bullish Symmetrical Triangle
was formed on 02.04 at 10:35:34 (UTC+0)
signal strength 1 of 5
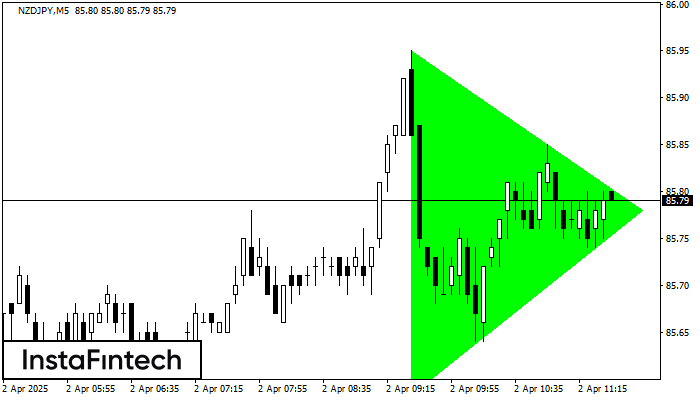
According to the chart of M5, NZDJPY formed the Bullish Symmetrical Triangle pattern, which signals the trend will continue. Description. The upper border of the pattern touches the coordinates 85.95/85.78 whereas the lower border goes across 85.58/85.78. The pattern width is measured on the chart at 37 pips. If the Bullish Symmetrical Triangle pattern is in progress during the upward trend, this indicates the current trend will go on. In case 85.78 is broken, the price could continue its move toward 85.93.
The M5 and M15 time frames may have more false entry points.
Lihat juga
- All
- All
- Bearish Rectangle
- Bearish Symmetrical Triangle
- Bearish Symmetrical Triangle
- Bullish Rectangle
- Double Top
- Double Top
- Triple Bottom
- Triple Bottom
- Triple Top
- Triple Top
- All
- All
- Buy
- Sale
- All
- 1
- 2
- 3
- 4
- 5
Persegi Bullish
was formed on 08.04 at 08:41:05 (UTC+0)
signal strength 1 of 5
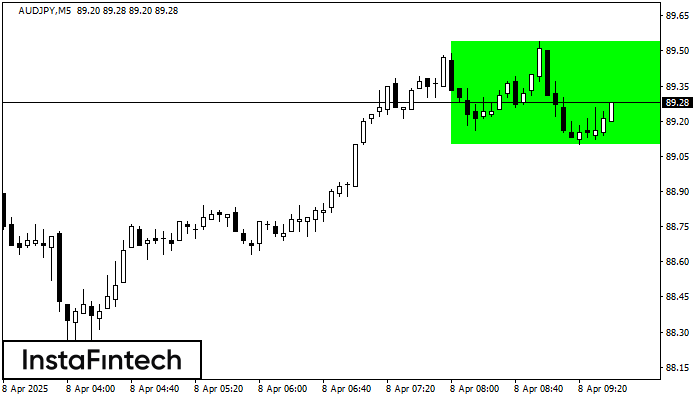
Menurut grafik dari M5, AUDJPY terbentuk Persegi Bullish. Jenis pola ini menunjukkan kelanjutan tren. Terdiri dari dua tingkat: resistance 89.54 dan support 89.10. Jika level resistance 89.54 - 89.54 ditembus
Rangka waktu M5 dan M15 mungkin memiliki lebih dari titik entri yang keliru.
Open chart in a new window
Segitiga Simetris Bullish
was formed on 08.04 at 08:31:09 (UTC+0)
signal strength 1 of 5
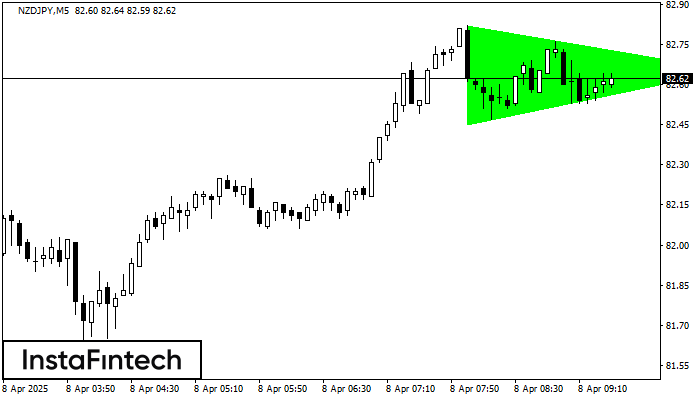
Menurut Grafik dari M5, NZDJPY dibentuk pola Segitiga Simetris Bullish. Deskripsi: Ini merupakan pola dari kelanjutan tren. 82.82 dan 82.45 adalah kordinat masing-masing dari batas atas dan lebih rendah. Lebar
Rangka waktu M5 dan M15 mungkin memiliki lebih dari titik entri yang keliru.
Open chart in a new window
Teratas Triple
was formed on 08.04 at 08:30:23 (UTC+0)
signal strength 3 of 5
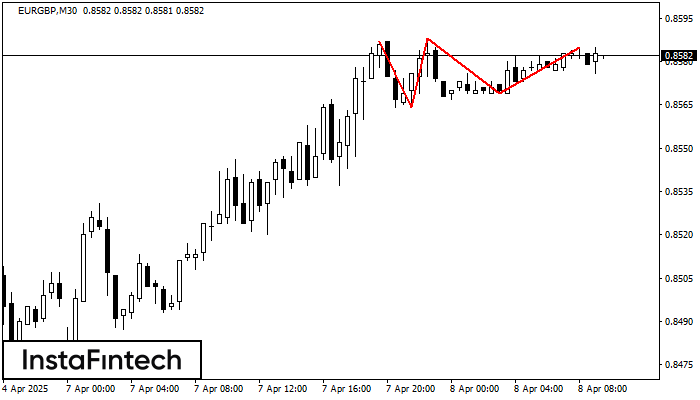
Pola Teratas Triple telah terbentuk pada grafik instrumen trading EURGBP M30. Pola tersebut merupakan pola reversal menampilkan karakteristik berikut: level resistance 2, levek support -5, dan lebar pola 23. Prakiraan
Open chart in a new window


