

Pola sebenarnya

Bullish Rectangle
was formed on 08.04 at 08:41:05 (UTC+0)
signal strength 1 of 5
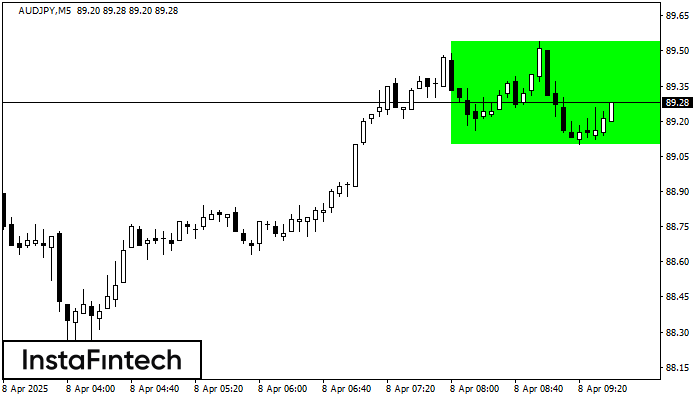
According to the chart of M5, AUDJPY formed the Bullish Rectangle. This type of a pattern indicates a trend continuation. It consists of two levels: resistance 89.54 and support 89.10. In case the resistance level 89.54 - 89.54 is broken, the instrument is likely to follow the bullish trend.
The M5 and M15 time frames may have more false entry points.
- All
- All
- Bearish Rectangle
- Bearish Symmetrical Triangle
- Bearish Symmetrical Triangle
- Bullish Rectangle
- Double Top
- Double Top
- Triple Bottom
- Triple Bottom
- Triple Top
- Triple Top
- All
- All
- Buy
- Sale
- All
- 1
- 2
- 3
- 4
- 5
Bawah Ganda
was formed on 08.05 at 00:05:16 (UTC+0)
signal strength 1 of 5
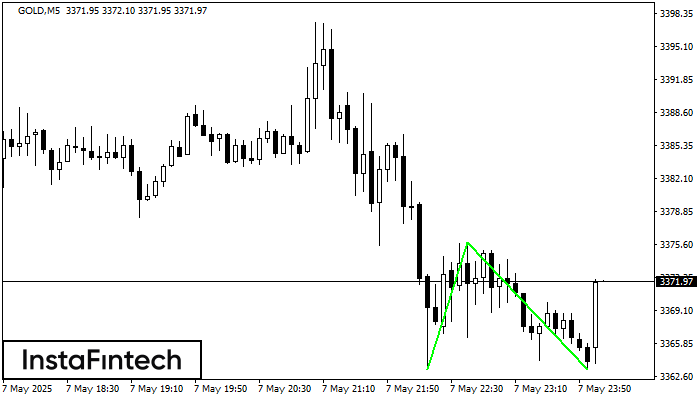
Pola Bawah Ganda telah terbentuk pada GOLD M5; batas atas di 3375.87; batas bawah di 3363.32. Lebar pola sebesar 1258 poin. Jika harga menembus batas atas 3375.87, Perubahan dalam tren
Rangka waktu M5 dan M15 mungkin memiliki lebih dari titik entri yang keliru.
Open chart in a new window
Bawah Triple
was formed on 07.05 at 23:25:32 (UTC+0)
signal strength 1 of 5
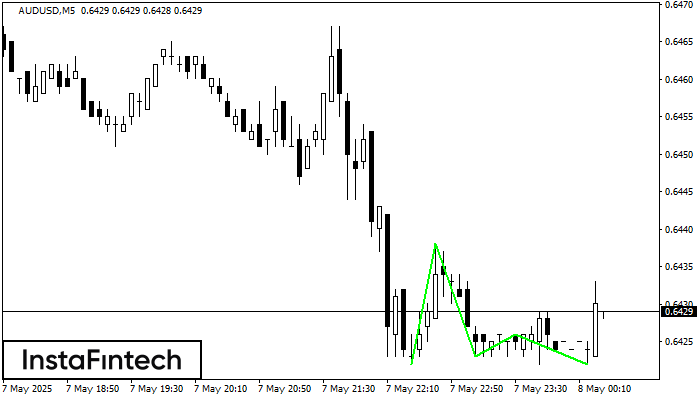
Pola Bawah Triple telah terbentuk pada grafik AUDUSD M5. Fitur-fitur pola: garis bawah pola memiliki koordinat 0.6438 dengan batas atas 0.6438/0.6426, proyeksi lebar adalah 16 poin. Pembentukan pola Bawah Triple
Rangka waktu M5 dan M15 mungkin memiliki lebih dari titik entri yang keliru.
Open chart in a new window
Bawah Ganda
was formed on 07.05 at 23:15:23 (UTC+0)
signal strength 2 of 5
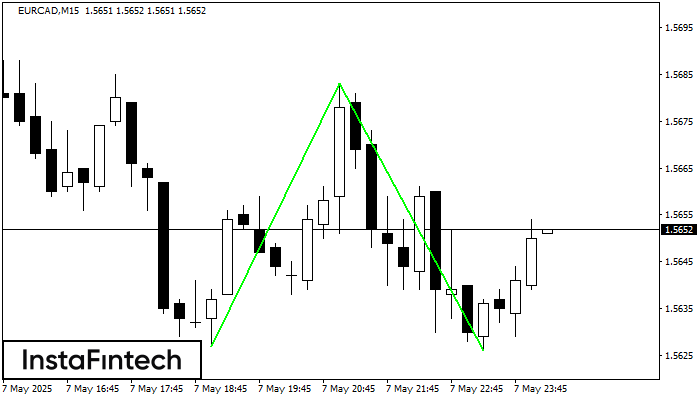
Pola Bawah Ganda telah terbentuk pada EURCAD M15; batas atas di 1.5683; batas bawah di 1.5626. Lebar pola sebesar 56 poin. Jika harga menembus batas atas 1.5683, Perubahan dalam tren
Rangka waktu M5 dan M15 mungkin memiliki lebih dari titik entri yang keliru.
Open chart in a new window


