

Pola sebenarnya

Bullish Symmetrical Triangle
was formed on 21.03 at 22:40:31 (UTC+0)
signal strength 1 of 5

According to the chart of M5, AUDUSD formed the Bullish Symmetrical Triangle pattern. Description: This is the pattern of a trend continuation. 0.6279 and 0.6267 are the coordinates of the upper and lower borders respectively. The pattern width is measured on the chart at 12 pips. Outlook: If the upper border 0.6279 is broken, the price is likely to continue its move by 0.6288.
The M5 and M15 time frames may have more false entry points.
- All
- All
- Bearish Rectangle
- Bearish Symmetrical Triangle
- Bearish Symmetrical Triangle
- Bullish Rectangle
- Double Top
- Double Top
- Triple Bottom
- Triple Bottom
- Triple Top
- Triple Top
- All
- All
- Buy
- Sale
- All
- 1
- 2
- 3
- 4
- 5
Đáy đôi
was formed on 22.04 at 07:00:30 (UTC+0)
signal strength 1 of 5
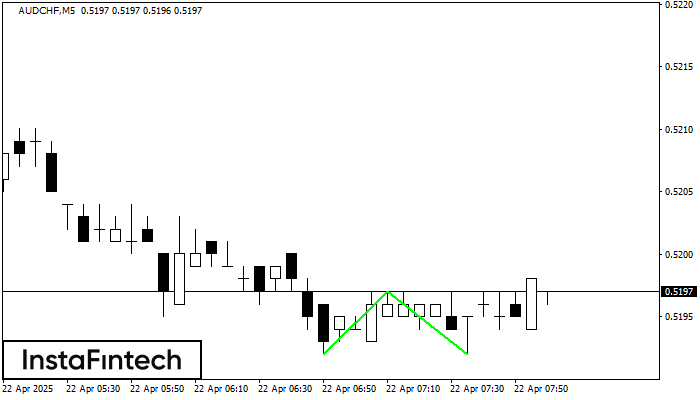
Mô hình Đáy đôi đã được hình thành trên AUDCHF M5; đường viền trên là 0.5197; đường viền dưới là 0.5192. Độ rộng của mô hình là 5 điểm. Trong
Khung thời gian M5 và M15 có thể có nhiều điểm vào lệnh sai hơn.
Open chart in a new window
Đỉnh đôi
was formed on 22.04 at 06:46:04 (UTC+0)
signal strength 1 of 5
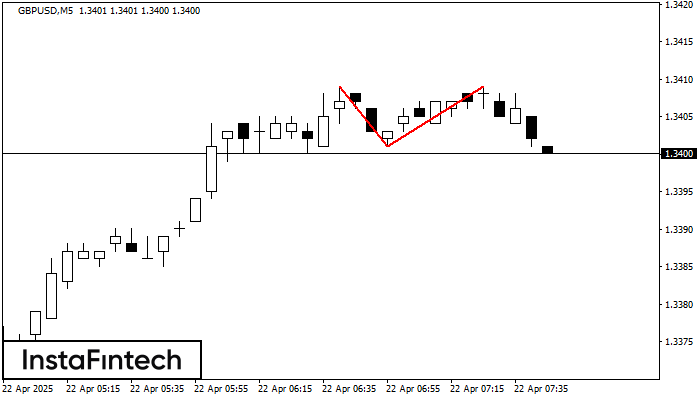
Trên biểu đồ GBPUSD M5, mô hình đảo chiều Đỉnh đôi đã được hình thành. Đặc điểm: ranh giới trên ở 1.3409; ranh giới dưới ở 1.3401; chiều rộng
Khung thời gian M5 và M15 có thể có nhiều điểm vào lệnh sai hơn.
Open chart in a new window
Hình chữ nhật giảm
was formed on 22.04 at 06:31:47 (UTC+0)
signal strength 1 of 5
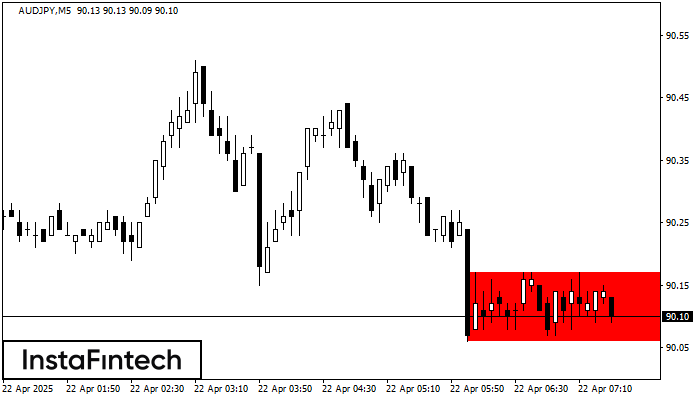
Theo biểu đồ của M5, AUDJPY đã tạo thành Hình chữ nhật giảm. Loại mô hình này cho thấy sự tiếp tục xu hướng
Khung thời gian M5 và M15 có thể có nhiều điểm vào lệnh sai hơn.
Open chart in a new window


