

Các mẫu thực tế

Các mẫu là các mô hình đồ họa được hình thành trong biểu đồ theo giá. Theo một trong những định đề phân tích kỹ thuật, lịch sử (chuyển động giá) thường tự lặp lại. Có nghĩa là biến động giá thường giống nhau trong các tình huống giống nhau, do đó có thể dự đoán chuyển động tiếp theo của tình huống với xác suất cao.
Các mẫu hữu quan của InstaTrade là một dịch vụ dễ sử dụng cho phép bạn nhận biết được những thay đổi mới nhất trên thị trường và phản ứng kịp thời với các dấu hiệu từ thị trường. Trong dịch vụ của chúng tôi, bạn sẽ luôn tìm thấy các mẫu mới nhất và phù hợp nhất trên bất kỳ cặp nào và bất kỳ khung thời gian nào.
Double Top
was formed on 22.04 at 06:46:04 (UTC+0)
signal strength 1 of 5
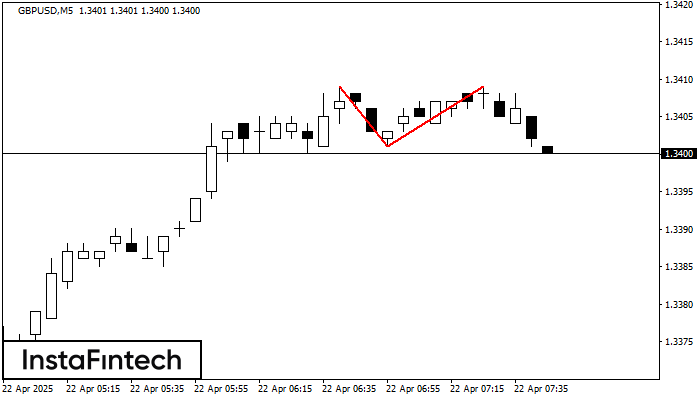
On the chart of GBPUSD M5 the Double Top reversal pattern has been formed. Characteristics: the upper boundary 1.3409; the lower boundary 1.3401; the width of the pattern 8 points. The signal: a break of the lower boundary will cause continuation of the downward trend targeting the 1.3386 level.
The M5 and M15 time frames may have more false entry points.
- All
- All
- Bearish Rectangle
- Bearish Symmetrical Triangle
- Bearish Symmetrical Triangle
- Bullish Rectangle
- Double Top
- Double Top
- Triple Bottom
- Triple Bottom
- Triple Top
- Triple Top
- All
- All
- Buy
- Sale
- All
- 1
- 2
- 3
- 4
- 5
Retângulo de baixa
was formed on 15.05 at 06:55:13 (UTC+0)
signal strength 1 of 5

De acordo com o gráfico de M5, GBPJPY formou Retângulo de baixa. Este tipo de padrão indica uma continuação da tendência. Ele consiste em dois níveis: resistência 194.04 – 0.00
Os intervalos M5 e M15 podem ter mais pontos de entrada falsos.
Open chart in a new window
Retângulo de baixa
was formed on 15.05 at 06:36:51 (UTC+0)
signal strength 1 of 5
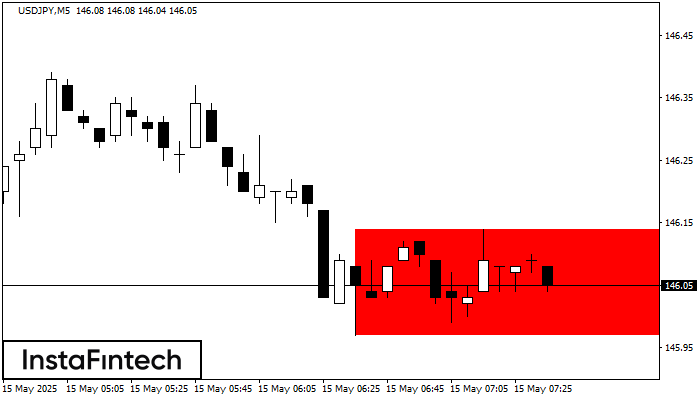
De acordo com o gráfico de M5, USDJPY formou Retângulo de baixa. O padrão indica uma continuação da tendência. O limite superior é 146.14, o limite inferior é 145.97
Os intervalos M5 e M15 podem ter mais pontos de entrada falsos.
Open chart in a new window
Pennant de baixa
was formed on 15.05 at 06:03:56 (UTC+0)
signal strength 2 of 5

O padrão Pennant de baixa foi formado no gráfico USDJPY M15. Este tipo de padrão é caracterizado por uma ligeira desaceleração após a qual o preço se moverá na direção
Os intervalos M5 e M15 podem ter mais pontos de entrada falsos.
Open chart in a new window
