

Các mẫu thực tế

Các mẫu là các mô hình đồ họa được hình thành trong biểu đồ theo giá. Theo một trong những định đề phân tích kỹ thuật, lịch sử (chuyển động giá) thường tự lặp lại. Có nghĩa là biến động giá thường giống nhau trong các tình huống giống nhau, do đó có thể dự đoán chuyển động tiếp theo của tình huống với xác suất cao.
Các mẫu hữu quan của InstaTrade là một dịch vụ dễ sử dụng cho phép bạn nhận biết được những thay đổi mới nhất trên thị trường và phản ứng kịp thời với các dấu hiệu từ thị trường. Trong dịch vụ của chúng tôi, bạn sẽ luôn tìm thấy các mẫu mới nhất và phù hợp nhất trên bất kỳ cặp nào và bất kỳ khung thời gian nào.
Bullish Rectangle
was formed on 15.04 at 22:01:27 (UTC+0)
signal strength 3 of 5

According to the chart of M30, NZDCHF formed the Bullish Rectangle. This type of a pattern indicates a trend continuation. It consists of two levels: resistance 0.4859 and support 0.4839. In case the resistance level 0.4859 - 0.4859 is broken, the instrument is likely to follow the bullish trend.
- All
- All
- Bearish Rectangle
- Bearish Symmetrical Triangle
- Bearish Symmetrical Triangle
- Bullish Rectangle
- Double Top
- Double Top
- Triple Bottom
- Triple Bottom
- Triple Top
- Triple Top
- All
- All
- Buy
- Sale
- All
- 1
- 2
- 3
- 4
- 5
Topo duplo
was formed on 16.05 at 04:00:21 (UTC+0)
signal strength 1 of 5
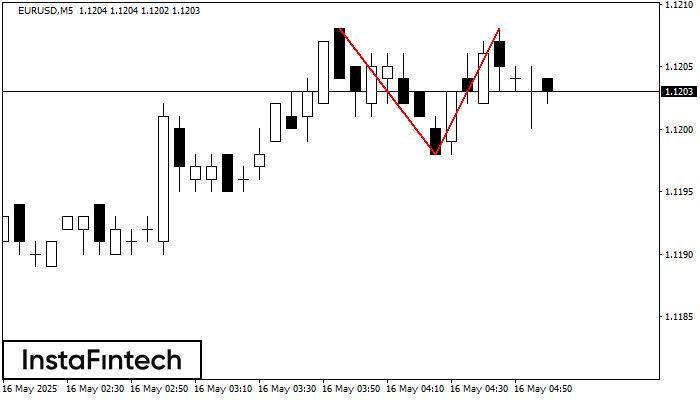
O padrão de reversão Topo duplo foi formado em EURUSD M5. Características: o limite superior 1.1208; o limite inferior 1.1198; a largura do padrão é de 10 pontos. As operações
Os intervalos M5 e M15 podem ter mais pontos de entrada falsos.
Open chart in a new window
Fundo duplo
was formed on 16.05 at 03:20:16 (UTC+0)
signal strength 1 of 5
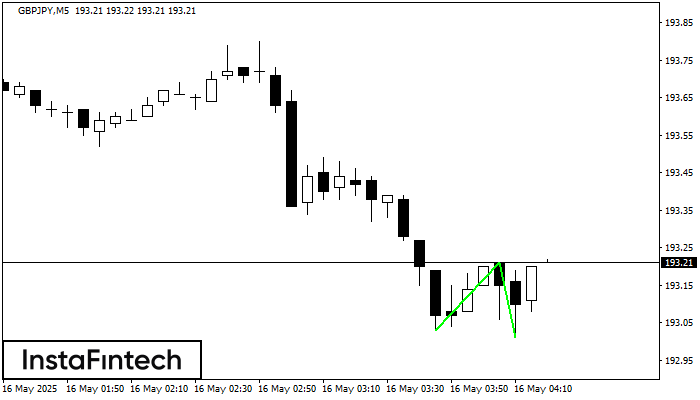
O padrão Fundo duplo foi formado em GBPJPY M5; o limite superior é 193.21; o limite inferior é 193.01. A largura do padrão é de 18 pontos. No caso
Os intervalos M5 e M15 podem ter mais pontos de entrada falsos.
Open chart in a new window
Topo duplo
was formed on 16.05 at 03:15:25 (UTC+0)
signal strength 2 of 5
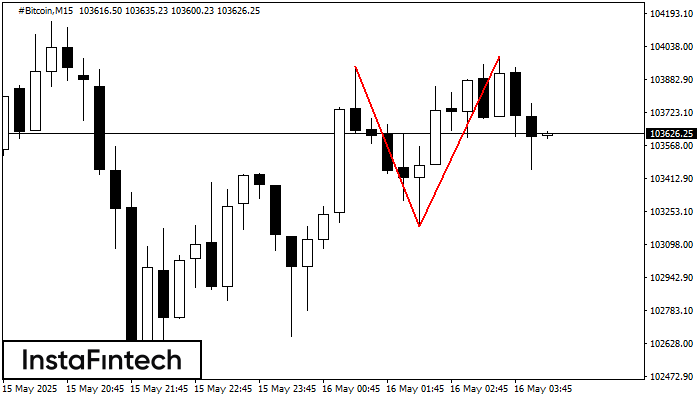
No gráfico de #Bitcoin M15 o padrão de reversão Topo duplo foi formado. Características: o limite superior 103989.31; o limite inferior 103182.63; a largura do padrão 80668 pontos. O sinal
Os intervalos M5 e M15 podem ter mais pontos de entrada falsos.
Open chart in a new window
