

Các mẫu thực tế

Các mẫu là các mô hình đồ họa được hình thành trong biểu đồ theo giá. Theo một trong những định đề phân tích kỹ thuật, lịch sử (chuyển động giá) thường tự lặp lại. Có nghĩa là biến động giá thường giống nhau trong các tình huống giống nhau, do đó có thể dự đoán chuyển động tiếp theo của tình huống với xác suất cao.
Các mẫu hữu quan của InstaTrade là một dịch vụ dễ sử dụng cho phép bạn nhận biết được những thay đổi mới nhất trên thị trường và phản ứng kịp thời với các dấu hiệu từ thị trường. Trong dịch vụ của chúng tôi, bạn sẽ luôn tìm thấy các mẫu mới nhất và phù hợp nhất trên bất kỳ cặp nào và bất kỳ khung thời gian nào.
Bearish pennant
was formed on 14.04 at 20:46:59 (UTC+0)
signal strength 3 of 5

The Bearish pennant pattern has formed on the EURJPY M30 chart. It signals potential continuation of the existing trend. Specifications: the pattern’s bottom has the coordinate of 162.05; the projection of the flagpole height is equal to 88 pips. In case the price breaks out the pattern’s bottom of 162.05, the downtrend is expected to continue for further level 161.75.
- All
- All
- Bearish Rectangle
- Bearish Symmetrical Triangle
- Bearish Symmetrical Triangle
- Bullish Rectangle
- Double Top
- Double Top
- Triple Bottom
- Triple Bottom
- Triple Top
- Triple Top
- All
- All
- Buy
- Sale
- All
- 1
- 2
- 3
- 4
- 5
Double Bottom
was formed on 05.05 at 23:30:42 (UTC+0)
signal strength 2 of 5
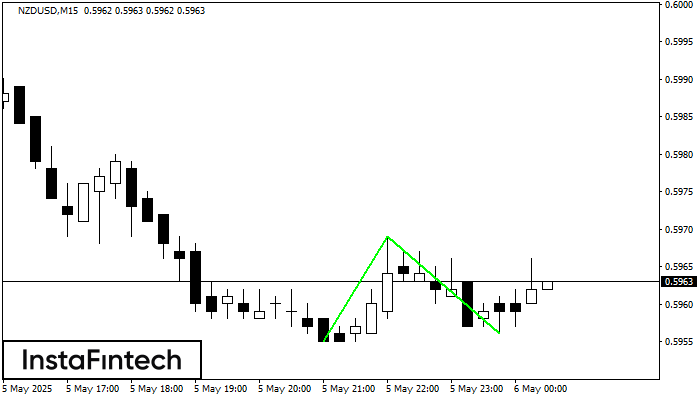
Corak Double Bottom telah dibentuk pada NZDUSD M15. Ciri-ciri: tahap sokongan 0.5955; tahap rintangan 0.5969; lebar corak 14 mata. Sekiranya tahap rintangan ditembusi, perubahan aliran boleh diramalkan dengan titik sasaran
Carta masa M5 dan M15 mungkin mempunyai lebih banyak titik kemasukan palsu.
Open chart in a new window
Double Top
was formed on 05.05 at 23:00:46 (UTC+0)
signal strength 2 of 5
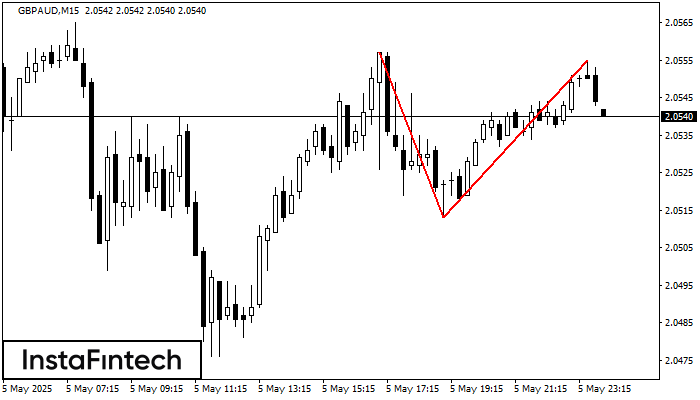
Pada carta GBPAUD M15 corak pembalikan Double Top telah terbentuk. Ciri-ciri: sempadan atas 2.0555; sempadan bawah 2.0513; lebar corak 42 mata. Isyarat: penembusan sempadan bawah akan menyebabkan kesinambungan arah aliran
Carta masa M5 dan M15 mungkin mempunyai lebih banyak titik kemasukan palsu.
Open chart in a new window
Double Top
was formed on 05.05 at 22:25:24 (UTC+0)
signal strength 1 of 5
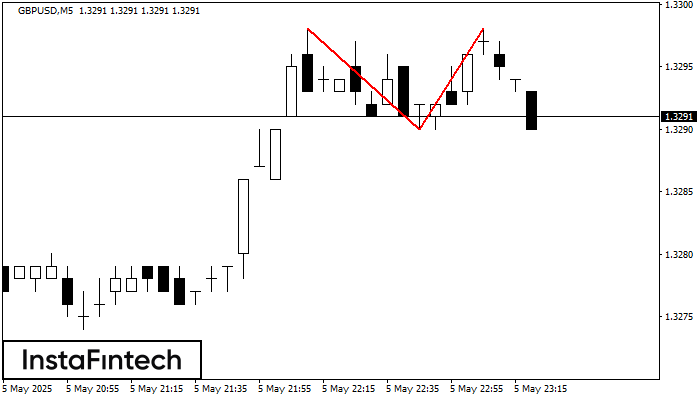
Corak pembalikan Double Top telah dibentuk pada GBPUSD M5. Ciri-ciri: sempadan atas %P0.000000; sempadan bawah 1.3298; sempadan bawah 1.3290; lebar corak adalah 8 mata. Dagangan menjual adalah lebih baik untuk
Carta masa M5 dan M15 mungkin mempunyai lebih banyak titik kemasukan palsu.
Open chart in a new window
