

Các mẫu thực tế

Các mẫu là các mô hình đồ họa được hình thành trong biểu đồ theo giá. Theo một trong những định đề phân tích kỹ thuật, lịch sử (chuyển động giá) thường tự lặp lại. Có nghĩa là biến động giá thường giống nhau trong các tình huống giống nhau, do đó có thể dự đoán chuyển động tiếp theo của tình huống với xác suất cao.
Các mẫu hữu quan của InstaTrade là một dịch vụ dễ sử dụng cho phép bạn nhận biết được những thay đổi mới nhất trên thị trường và phản ứng kịp thời với các dấu hiệu từ thị trường. Trong dịch vụ của chúng tôi, bạn sẽ luôn tìm thấy các mẫu mới nhất và phù hợp nhất trên bất kỳ cặp nào và bất kỳ khung thời gian nào.
Double Bottom
was formed on 03.04 at 15:14:54 (UTC+0)
signal strength 2 of 5
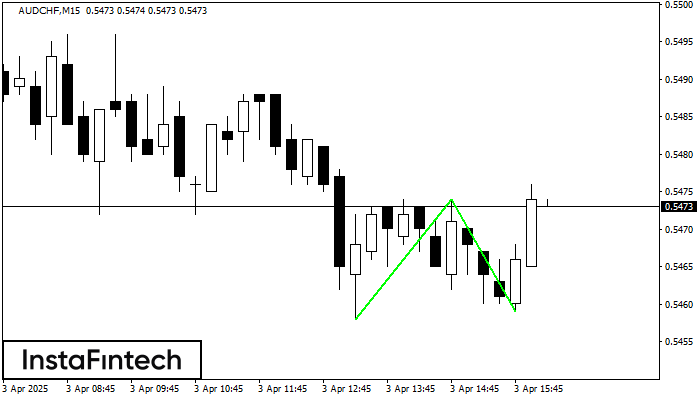
The Double Bottom pattern has been formed on AUDCHF M15; the upper boundary is 0.5474; the lower boundary is 0.5459. The width of the pattern is 16 points. In case of a break of the upper boundary 0.5474, a change in the trend can be predicted where the width of the pattern will coincide with the distance to a possible take profit level.
The M5 and M15 time frames may have more false entry points.
- All
- All
- Bearish Rectangle
- Bearish Symmetrical Triangle
- Bearish Symmetrical Triangle
- Bullish Rectangle
- Double Top
- Double Top
- Triple Bottom
- Triple Bottom
- Triple Top
- Triple Top
- All
- All
- Buy
- Sale
- All
- 1
- 2
- 3
- 4
- 5
Tam giác Cân Giảm
was formed on 21.05 at 04:39:41 (UTC+0)
signal strength 3 of 5
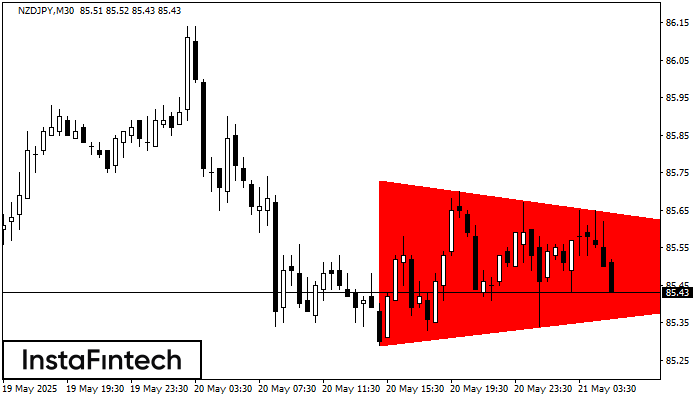
Theo biểu đồ của M30, NZDJPY đã hình thành mô hình Tam giác Cân Giảm. Mô tả: Đường biên giới thấp hơn là 85.29/85.49 và đường biên giới
Open chart in a new window
Hình chữ nhật giảm
was formed on 21.05 at 04:39:35 (UTC+0)
signal strength 3 of 5
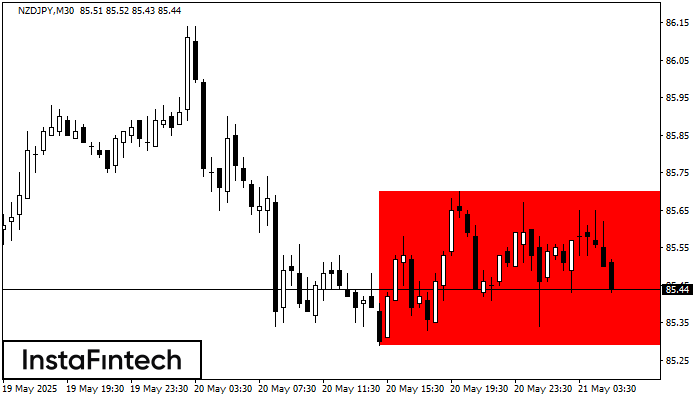
Theo biểu đồ của M30, NZDJPY đã tạo thành Hình chữ nhật giảm. Loại mô hình này cho thấy sự tiếp tục xu hướng
Open chart in a new window
Hình chữ nhật tăng
was formed on 21.05 at 04:25:18 (UTC+0)
signal strength 3 of 5
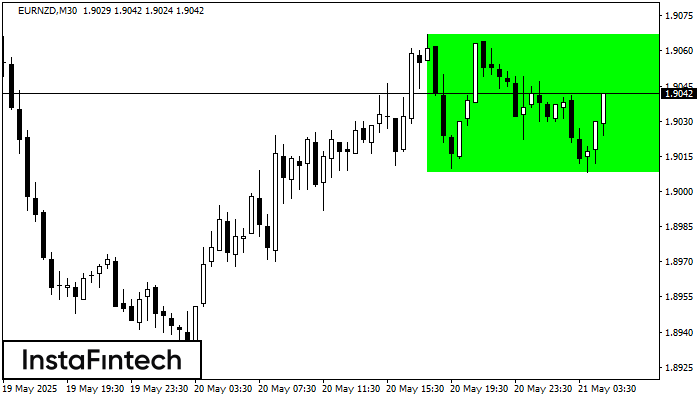
Theo biểu đồ của M30, EURNZD đã hình thành Hình chữ nhật tăng, cái mà là mô hình của sự tiếp tục xu hướng. Mô hình này được chứa trong
Open chart in a new window
