

Các mẫu thực tế

Các mẫu là các mô hình đồ họa được hình thành trong biểu đồ theo giá. Theo một trong những định đề phân tích kỹ thuật, lịch sử (chuyển động giá) thường tự lặp lại. Có nghĩa là biến động giá thường giống nhau trong các tình huống giống nhau, do đó có thể dự đoán chuyển động tiếp theo của tình huống với xác suất cao.
Các mẫu hữu quan của InstaTrade là một dịch vụ dễ sử dụng cho phép bạn nhận biết được những thay đổi mới nhất trên thị trường và phản ứng kịp thời với các dấu hiệu từ thị trường. Trong dịch vụ của chúng tôi, bạn sẽ luôn tìm thấy các mẫu mới nhất và phù hợp nhất trên bất kỳ cặp nào và bất kỳ khung thời gian nào.
Bearish Symmetrical Triangle
was formed on 28.03 at 13:02:25 (UTC+0)
signal strength 2 of 5
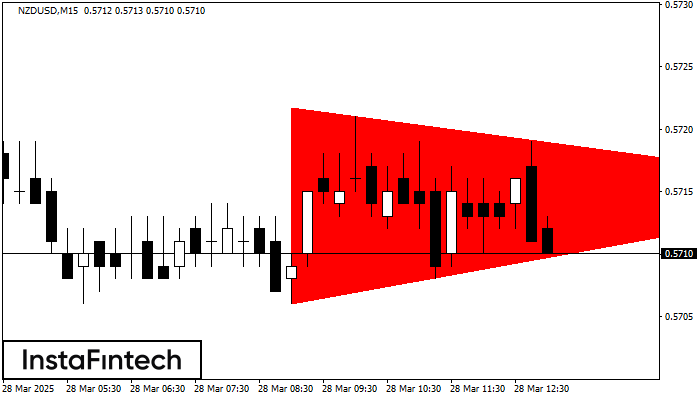
According to the chart of M15, NZDUSD formed the Bearish Symmetrical Triangle pattern. This pattern signals a further downward trend in case the lower border 0.5706 is breached. Here, a hypothetical profit will equal the width of the available pattern that is -16 pips.
The M5 and M15 time frames may have more false entry points.
Xem thêm
- All
- All
- Bearish Rectangle
- Bearish Symmetrical Triangle
- Bearish Symmetrical Triangle
- Bullish Rectangle
- Double Top
- Double Top
- Triple Bottom
- Triple Bottom
- Triple Top
- Triple Top
- All
- All
- Buy
- Sale
- All
- 1
- 2
- 3
- 4
- 5
Teratas Triple
was formed on 09.04 at 11:34:58 (UTC+0)
signal strength 1 of 5

Pada grafik instrumen trading NZDUSD M5, pola Teratas Triple yang menandakan perubahan trend telah terbentuk. Ada kemungkinan bahwa setelah pembentukan puncak (peak) ketiga, harga akan mencoba untuk menembus level resistance
Rangka waktu M5 dan M15 mungkin memiliki lebih dari titik entri yang keliru.
Open chart in a new window
Bawah Triple
was formed on 09.04 at 11:30:02 (UTC+0)
signal strength 3 of 5
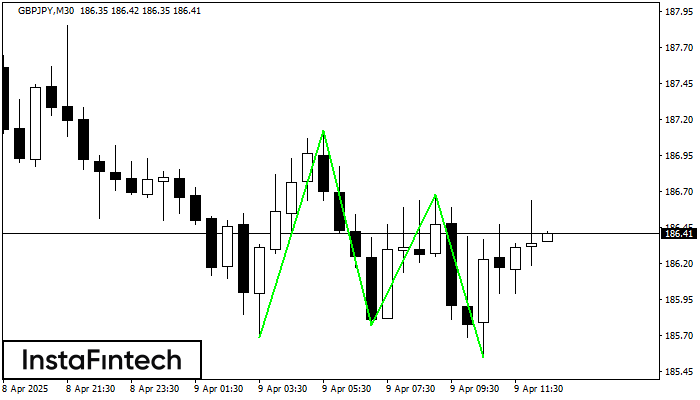
Pola Bawah Triple telah terbentuk pada grafik GBPJPY M30. Fitur-fitur pola: garis bawah pola memiliki koordinat 187.12 dengan batas atas 187.12/186.68, proyeksi lebar adalah 143 poin. Pembentukan pola Bawah Triple
Open chart in a new window
Persegi Bullish
was formed on 09.04 at 11:21:51 (UTC+0)
signal strength 1 of 5
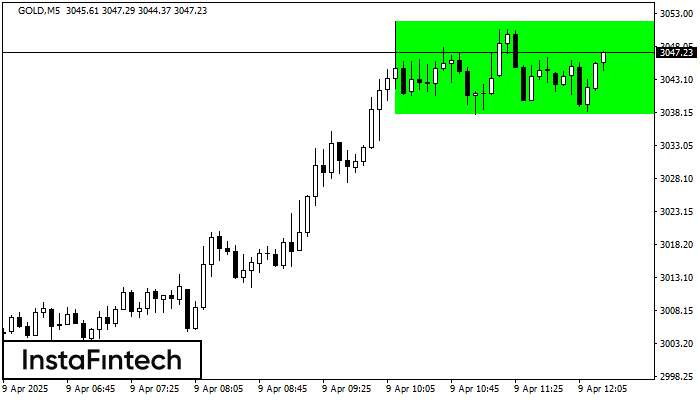
Menurut grafik dari M5, GOLD terbentuk Persegi Bullish. Jenis pola ini menunjukkan kelanjutan tren. Terdiri dari dua tingkat: resistance 3051.82 dan support 3037.74. Jika level resistance 3051.82 - 3051.82 ditembus
Rangka waktu M5 dan M15 mungkin memiliki lebih dari titik entri yang keliru.
Open chart in a new window
