

Các mẫu thực tế

Các mẫu là các mô hình đồ họa được hình thành trong biểu đồ theo giá. Theo một trong những định đề phân tích kỹ thuật, lịch sử (chuyển động giá) thường tự lặp lại. Có nghĩa là biến động giá thường giống nhau trong các tình huống giống nhau, do đó có thể dự đoán chuyển động tiếp theo của tình huống với xác suất cao.
Các mẫu hữu quan của InstaTrade là một dịch vụ dễ sử dụng cho phép bạn nhận biết được những thay đổi mới nhất trên thị trường và phản ứng kịp thời với các dấu hiệu từ thị trường. Trong dịch vụ của chúng tôi, bạn sẽ luôn tìm thấy các mẫu mới nhất và phù hợp nhất trên bất kỳ cặp nào và bất kỳ khung thời gian nào.
Double Top
was formed on 26.03 at 04:16:03 (UTC+0)
signal strength 1 of 5
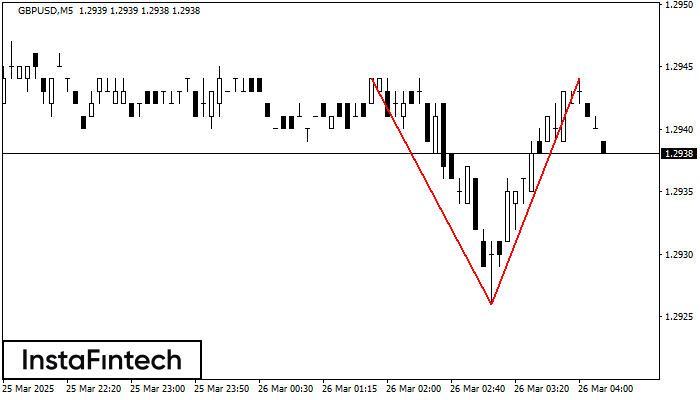
The Double Top pattern has been formed on GBPUSD M5. It signals that the trend has been changed from upwards to downwards. Probably, if the base of the pattern 1.2926 is broken, the downward movement will continue.
The M5 and M15 time frames may have more false entry points.
Xem thêm
- All
- All
- Bearish Rectangle
- Bearish Symmetrical Triangle
- Bearish Symmetrical Triangle
- Bullish Rectangle
- Double Top
- Double Top
- Triple Bottom
- Triple Bottom
- Triple Top
- Triple Top
- All
- All
- Buy
- Sale
- All
- 1
- 2
- 3
- 4
- 5
รูปแบบกราฟจุดสามยอด (Triple Top)
was formed on 08.04 at 05:00:22 (UTC+0)
signal strength 1 of 5
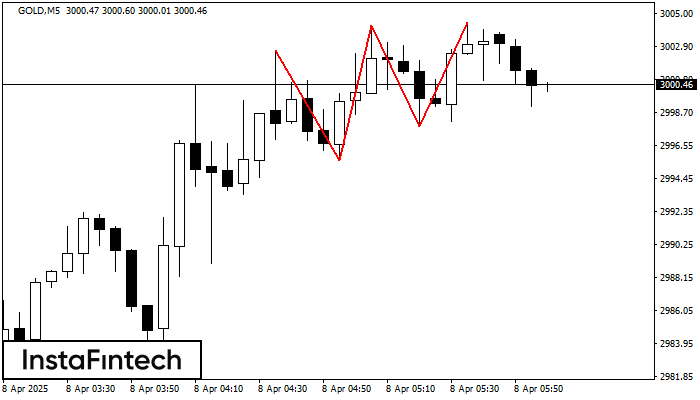
ในชาร์ตของตราสารการซื้อขาย GOLD M5 กราฟรูปแบบ รูปแบบกราฟจุดสามยอด (Triple Top) ที่แสดงให้เห็นถึง การเปลี่ยนแปลงของแนวโน้มที่ถูกสร้างขึ้นมา มันเป็นไปได้ที่ หลังจากการก่อตัวของระดับสูงสุดอันดับสามมาแล้ว ราคาจะพยายามเคลื่อนตัวทะลุผ่านระดับของแนวต้าน 2995.63 ที่พวกเราแนะนำให้เปิดสถานะการเทรดไว้เพื่อเป็นการขาย ตำแหน่งการทำกำไรเป็นระยะทางของความกว้างในกราฟรูปแบบนี้
ขอบเตระยะเวลาใน M5 และ M15 อาจจะมีตำแหน่งการเข้าใช้งานที่ผิดพลาดมากยิ่งขึ้น
Open chart in a new window
รูปแบบกราฟจุดสองยอดขาลง (Double Bottom)
was formed on 08.04 at 04:50:18 (UTC+0)
signal strength 1 of 5
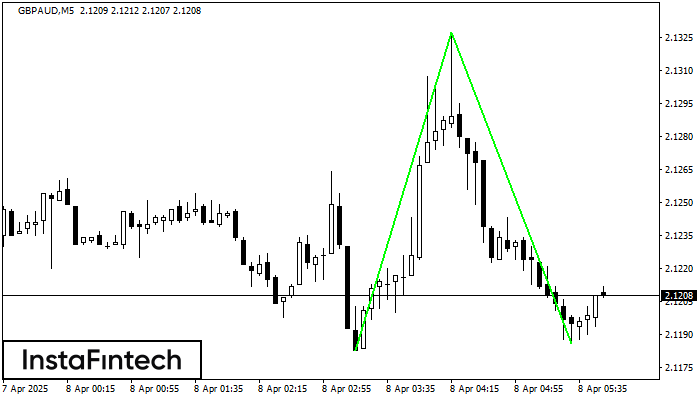
รูปแบบ รูปแบบกราฟจุดสองยอดขาลง (Double Bottom) ถูกสร้างขึ้นมาใน GBPAUD M5; ขอบเขตด้านบนอยู่ที่ 2.1327;ขอบเขตด้านล่าง คือ 2.1186 ความกว้างของรูปแบบนี้คือ 144 จุด กรณีที่มีการเคลื่อนตัวทะลุผ่านขอบเขตด้านบน
ขอบเตระยะเวลาใน M5 และ M15 อาจจะมีตำแหน่งการเข้าใช้งานที่ผิดพลาดมากยิ่งขึ้น
Open chart in a new window
รูปแบบกราฟจุดสามยอด (Triple Top)
was formed on 08.04 at 04:25:10 (UTC+0)
signal strength 1 of 5
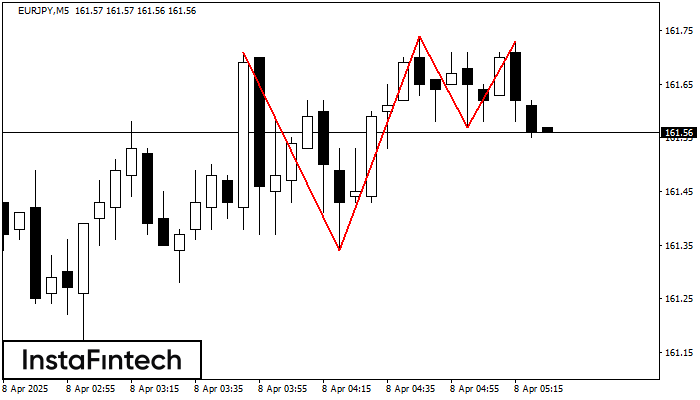
ในชาร์ตของตราสารการซื้อขาย EURJPY M5 กราฟรูปแบบ รูปแบบกราฟจุดสามยอด (Triple Top) ที่แสดงให้เห็นถึง การเปลี่ยนแปลงของแนวโน้มที่ถูกสร้างขึ้นมา มันเป็นไปได้ที่ หลังจากการก่อตัวของระดับสูงสุดอันดับสามมาแล้ว ราคาจะพยายามเคลื่อนตัวทะลุผ่านระดับของแนวต้าน 161.34 ที่พวกเราแนะนำให้เปิดสถานะการเทรดไว้เพื่อเป็นการขาย ตำแหน่งการทำกำไรเป็นระยะทางของความกว้างในกราฟรูปแบบนี้
ขอบเตระยะเวลาใน M5 และ M15 อาจจะมีตำแหน่งการเข้าใช้งานที่ผิดพลาดมากยิ่งขึ้น
Open chart in a new window
