

Dolzarb patternlar

Двойное дно
сформирован 28.04 в 22:00:24 (UTC+0)
сила сигнала 2 из 5
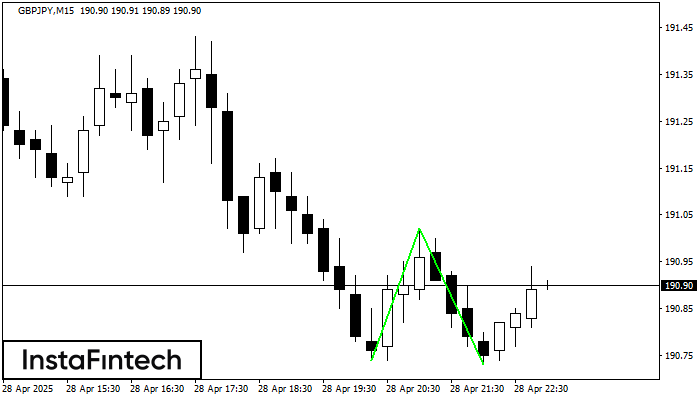
Сформирована фигура «Двойное дно» на графике GBPJPY M15. Данное формирование сигнализирует об изменении тенденции с нисходящего на восходящее движение. Сигнал: Торговую позицию на покупку следует открывать после пробоя верхней границы фигуры 191.02, где перспектива будущего хода будет являться шириной текущей фигуры - 28 пунктов.
Таймфреймы М5 и М15 могут иметь больше ложных точек входа.
Shuningdek ko'ring
- Все
- Все
- Bearish Rectangle
- Bearish Symmetrical Triangle
- Bearish Symmetrical Triangle
- Bullish Rectangle
- Double Top
- Double Top
- Triple Bottom
- Triple Bottom
- Triple Top
- Triple Top
- Все
- Все
- Покупка
- Продажа
- Все
- 1
- 2
- 3
- 4
- 5
Triple Top
сформирован 17.06 в 18:45:18 (UTC+0)
сила сигнала 1 из 5
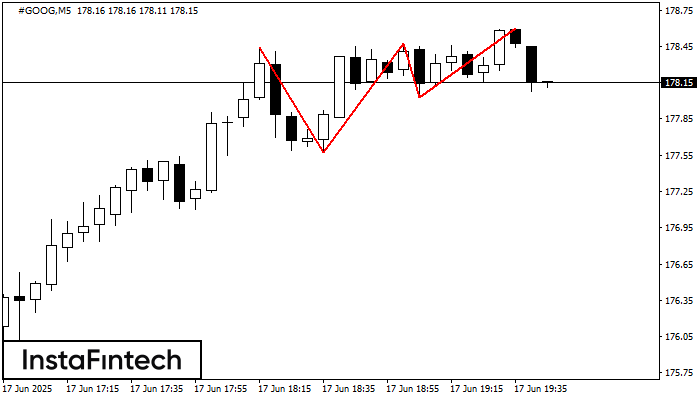
The Triple Top pattern has formed on the chart of the #GOOG M5 trading instrument. It is a reversal pattern featuring the following characteristics: resistance level -16, support level -46
The M5 and M15 time frames may have more false entry points.
Открыть график инструмента в новом окне
Double Bottom
сформирован 17.06 в 18:40:09 (UTC+0)
сила сигнала 1 из 5
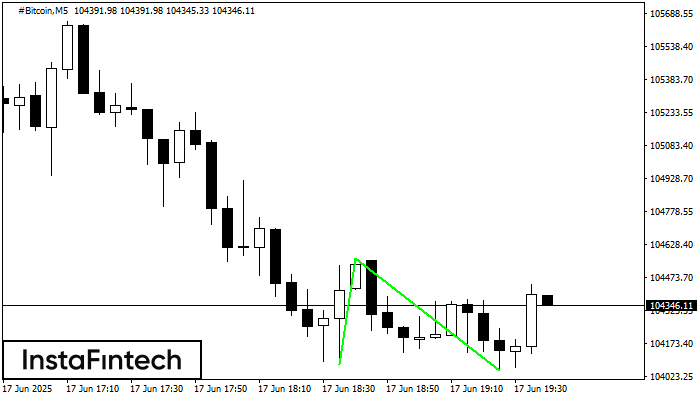
The Double Bottom pattern has been formed on #Bitcoin M5. Characteristics: the support level 104078.49; the resistance level 104563.94; the width of the pattern 48545 points. If the resistance level
The M5 and M15 time frames may have more false entry points.
Открыть график инструмента в новом окне
Head and Shoulders
сформирован 17.06 в 18:15:44 (UTC+0)
сила сигнала 1 из 5
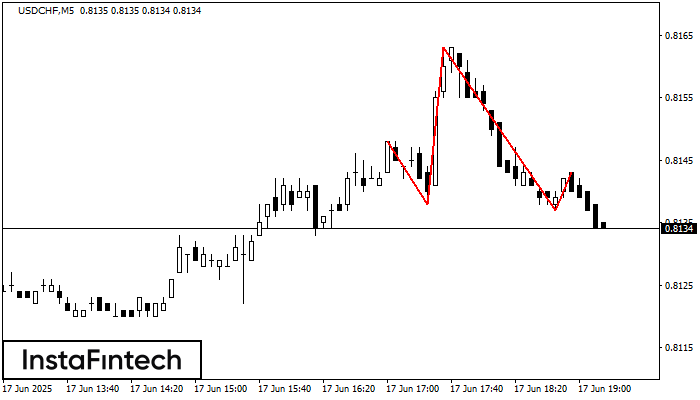
The technical pattern called Head and Shoulders has appeared on the chart of USDCHF M5. There are weighty reasons to suggest that the price will surpass the Neckline 0.8138/0.8137 after
The M5 and M15 time frames may have more false entry points.
Открыть график инструмента в новом окне


