

Dolzarb patternlar

Двойная вершина
сформирован 28.04 в 09:05:43 (UTC+0)
сила сигнала 1 из 5
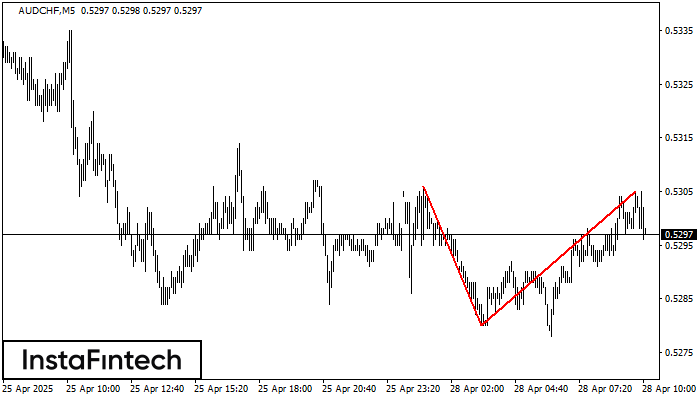
На торговом графике AUDCHF M5 сформировалась разворотная фигура «Двойная вершина». Характеристика: Верхняя граница 0.5305; Нижняя граница 0.5280; Ширина фигуры 25 пунктов. Сигнал: Пробой нижней границы 0.5280 приведет к дальнейшему нисходящему движению с перспективой хода к уровню 0.5265.
Таймфреймы М5 и М15 могут иметь больше ложных точек входа.
- Все
- Все
- Bearish Rectangle
- Bearish Symmetrical Triangle
- Bearish Symmetrical Triangle
- Bullish Rectangle
- Double Top
- Double Top
- Triple Bottom
- Triple Bottom
- Triple Top
- Triple Top
- Все
- Все
- Покупка
- Продажа
- Все
- 1
- 2
- 3
- 4
- 5
Bullish Rectangle
сформирован 14.05 в 07:47:39 (UTC+0)
сила сигнала 3 из 5
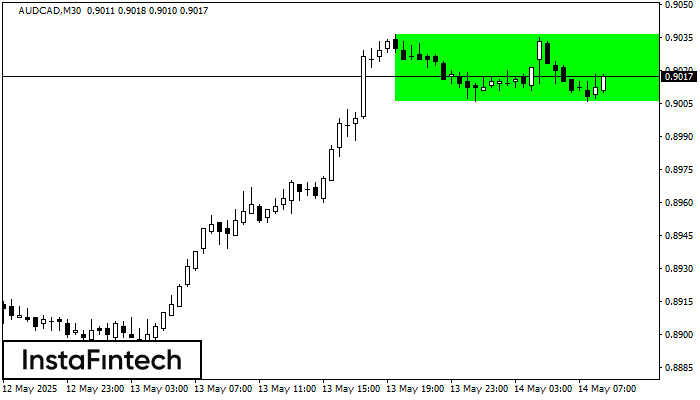
According to the chart of M30, AUDCAD formed the Bullish Rectangle. This type of a pattern indicates a trend continuation. It consists of two levels: resistance 0.9036 and support 0.9006
Открыть график инструмента в новом окне
Triple Bottom
сформирован 14.05 в 07:45:28 (UTC+0)
сила сигнала 2 из 5
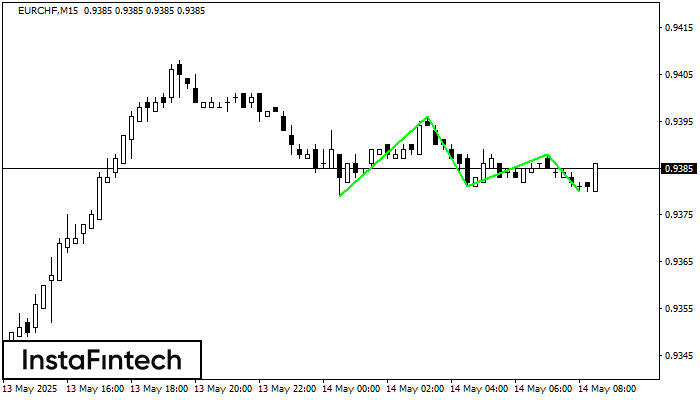
The Triple Bottom pattern has formed on the chart of the EURCHF M15 trading instrument. The pattern signals a change in the trend from downwards to upwards in the case
The M5 and M15 time frames may have more false entry points.
Открыть график инструмента в новом окне
Triple Bottom
сформирован 14.05 в 07:32:26 (UTC+0)
сила сигнала 2 из 5
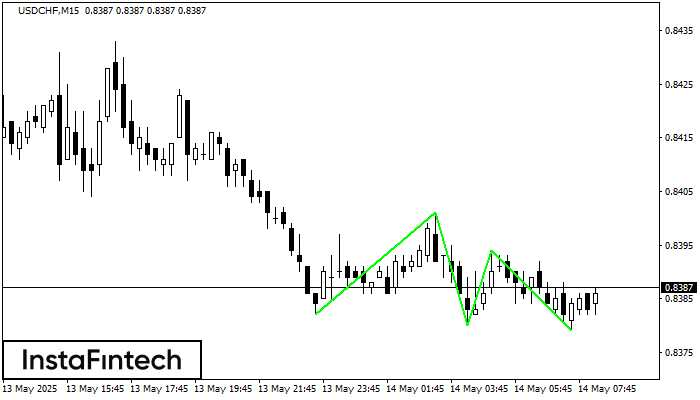
The Triple Bottom pattern has been formed on USDCHF M15. It has the following characteristics: resistance level 0.8401/0.8394; support level 0.8382/0.8379; the width is 19 points. In the event
The M5 and M15 time frames may have more false entry points.
Открыть график инструмента в новом окне


