

Dolzarb patternlar

Прямоугольник
сформирован 28.04 в 09:00:17 (UTC+0)
сила сигнала 3 из 5
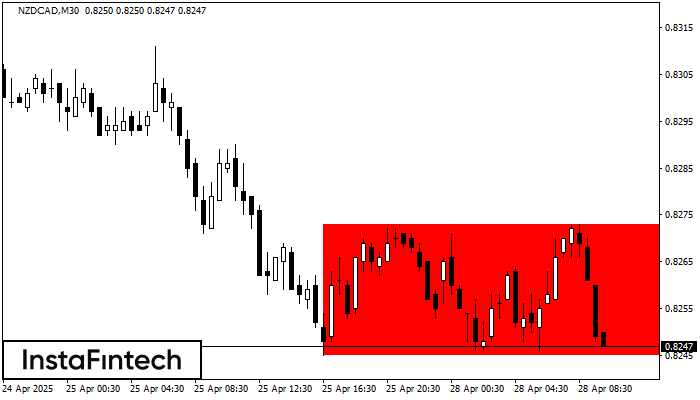
Сформирована фигура «Прямоугольник» на графике NZDCAD M30. Тип фигуры: Продолжение тренда; Границы: Верхняя 0.8273, Нижняя 0.8245; Сигнал: позиция на продажу открывается после фиксации цены ниже границы прямоугольника 0.8245.
- Все
- Все
- Bearish Rectangle
- Bearish Symmetrical Triangle
- Bearish Symmetrical Triangle
- Bullish Rectangle
- Double Top
- Double Top
- Triple Bottom
- Triple Bottom
- Triple Top
- Triple Top
- Все
- Все
- Покупка
- Продажа
- Все
- 1
- 2
- 3
- 4
- 5
Triple Bottom
сформирован 13.05 в 19:55:50 (UTC+0)
сила сигнала 1 из 5

The Triple Bottom pattern has formed on the chart of EURNZD M5. Features of the pattern: The lower line of the pattern has coordinates 1.8832 with the upper limit 1.8832/1.8824
The M5 and M15 time frames may have more false entry points.
Открыть график инструмента в новом окне
Bearish Flag
сформирован 13.05 в 19:33:48 (UTC+0)
сила сигнала 1 из 5
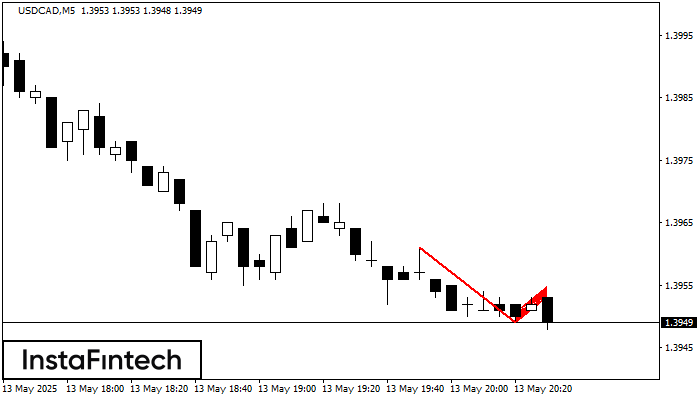
The Bearish Flag pattern has been formed on the chart USDCAD M5. Therefore, the downwards trend is likely to continue in the nearest term. As soon as the price breaks
The M5 and M15 time frames may have more false entry points.
Открыть график инструмента в новом окне
Triple Top
сформирован 13.05 в 18:45:11 (UTC+0)
сила сигнала 1 из 5
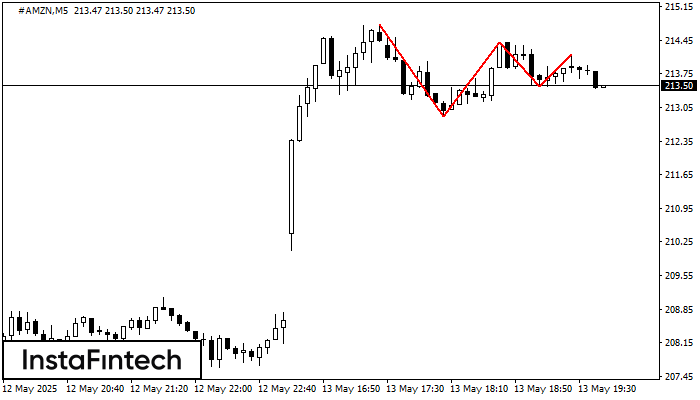
The Triple Top pattern has formed on the chart of the #AMZN M5 trading instrument. It is a reversal pattern featuring the following characteristics: resistance level 63, support level -61
The M5 and M15 time frames may have more false entry points.
Открыть график инструмента в новом окне


