

Dolzarb patternlar

Двойная вершина
сформирован 16.04 в 10:45:17 (UTC+0)
сила сигнала 2 из 5
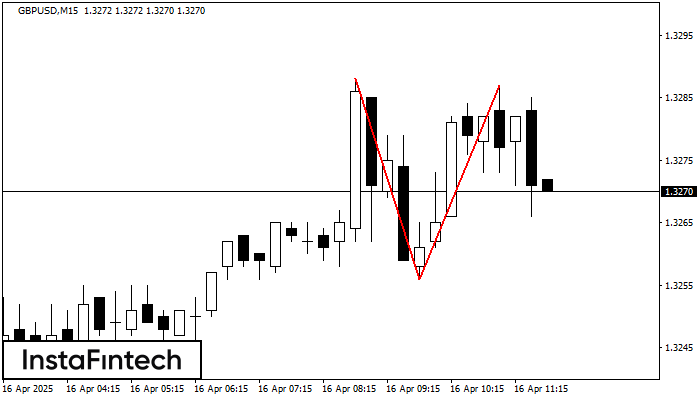
По GBPUSD на M15 сформировалась разворотная фигура «Двойная вершина». Характеристика: Верхняя граница 1.3288; Нижняя граница 1.3256; Ширина фигуры 31 пунктов. Позицию на продажу возможно открыть ниже нижней границы 1.3256, с перспективой хода к уровню 1.3233.
Таймфреймы М5 и М15 могут иметь больше ложных точек входа.
- Все
- Все
- Bearish Rectangle
- Bearish Symmetrical Triangle
- Bearish Symmetrical Triangle
- Bullish Rectangle
- Double Top
- Double Top
- Triple Bottom
- Triple Bottom
- Triple Top
- Triple Top
- Все
- Все
- Покупка
- Продажа
- Все
- 1
- 2
- 3
- 4
- 5
Bullish Symmetrical Triangle
was formed on 18.06 at 15:05:56 (UTC+0)
signal strength 1 of 5
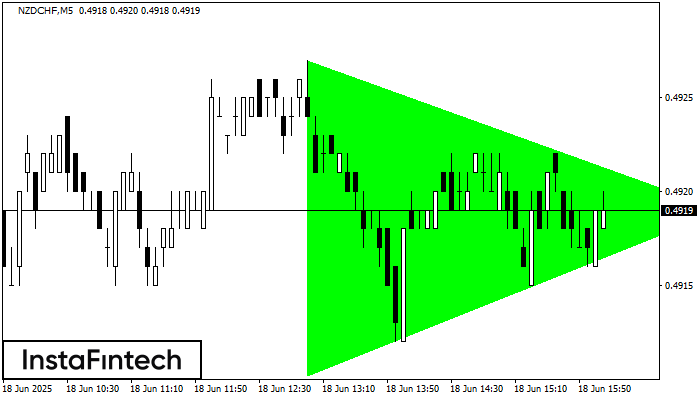
According to the chart of M5, NZDCHF formed the Bullish Symmetrical Triangle pattern. Description: This is the pattern of a trend continuation. 0.4927 and 0.4910 are the coordinates
The M5 and M15 time frames may have more false entry points.
Open chart in a new window
Bullish Symmetrical Triangle
was formed on 18.06 at 14:35:03 (UTC+0)
signal strength 2 of 5
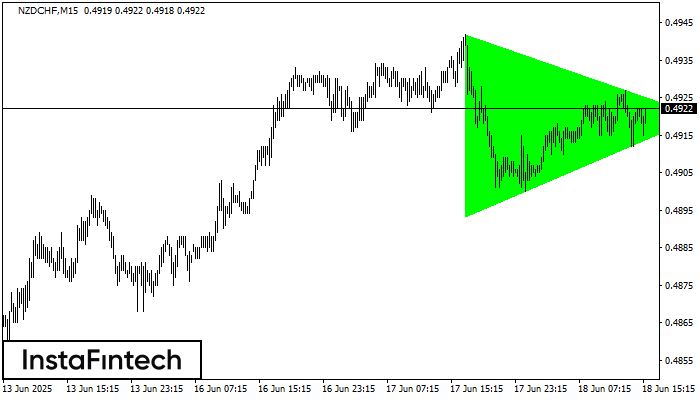
According to the chart of M15, NZDCHF formed the Bullish Symmetrical Triangle pattern. Description: This is the pattern of a trend continuation. 0.4942 and 0.4893 are the coordinates
The M5 and M15 time frames may have more false entry points.
Open chart in a new window
Bullish Symmetrical Triangle
was formed on 18.06 at 14:11:22 (UTC+0)
signal strength 4 of 5
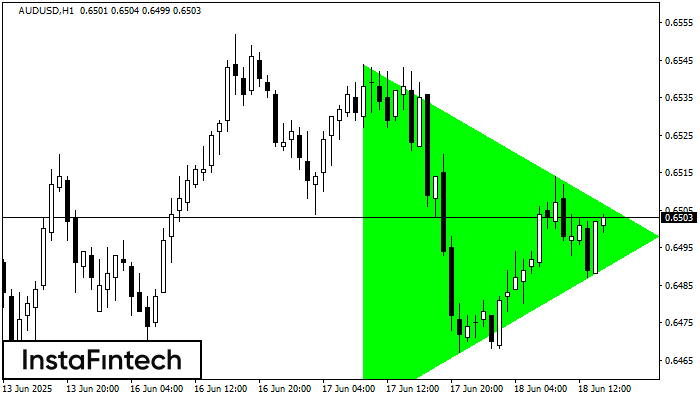
According to the chart of H1, AUDUSD formed the Bullish Symmetrical Triangle pattern. The lower border of the pattern touches the coordinates 0.6452/0.6498 whereas the upper border goes across 0.6544/0.6498
Open chart in a new window


