

Dolzarb patternlar

Двойная вершина
сформирован 16.04 в 10:30:11 (UTC+0)
сила сигнала 2 из 5
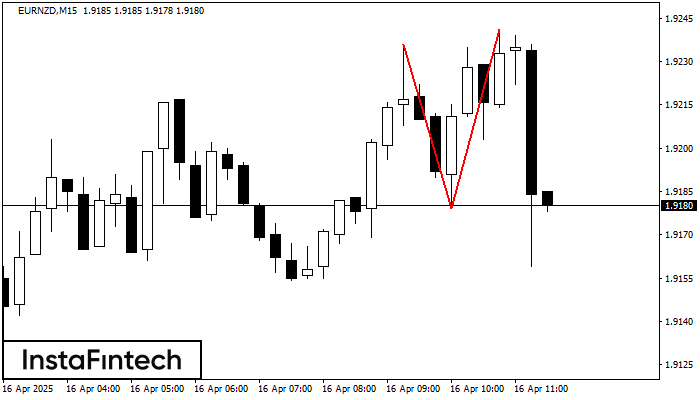
По EURNZD на M15 сформировалась разворотная фигура «Двойная вершина». Характеристика: Верхняя граница 1.9236; Нижняя граница 1.9179; Ширина фигуры 62 пунктов. Позицию на продажу возможно открыть ниже нижней границы 1.9179, с перспективой хода к уровню 1.9157.
Таймфреймы М5 и М15 могут иметь больше ложных точек входа.
- Все
- Все
- Bearish Rectangle
- Bearish Symmetrical Triangle
- Bearish Symmetrical Triangle
- Bullish Rectangle
- Double Top
- Double Top
- Triple Bottom
- Triple Bottom
- Triple Top
- Triple Top
- Все
- Все
- Покупка
- Продажа
- Все
- 1
- 2
- 3
- 4
- 5
Triple Bottom
сформирован 29.05 в 12:44:43 (UTC+0)
сила сигнала 1 из 5
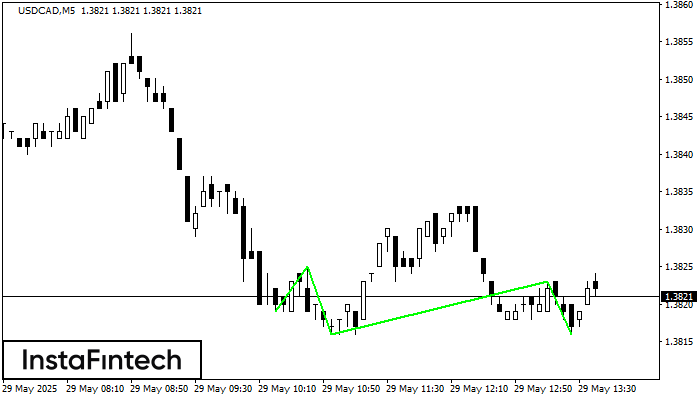
The Triple Bottom pattern has formed on the chart of USDCAD M5. Features of the pattern: The lower line of the pattern has coordinates 1.3825 with the upper limit 1.3825/1.3823
The M5 and M15 time frames may have more false entry points.
Открыть график инструмента в новом окне
Bearish Rectangle
сформирован 29.05 в 12:19:14 (UTC+0)
сила сигнала 1 из 5
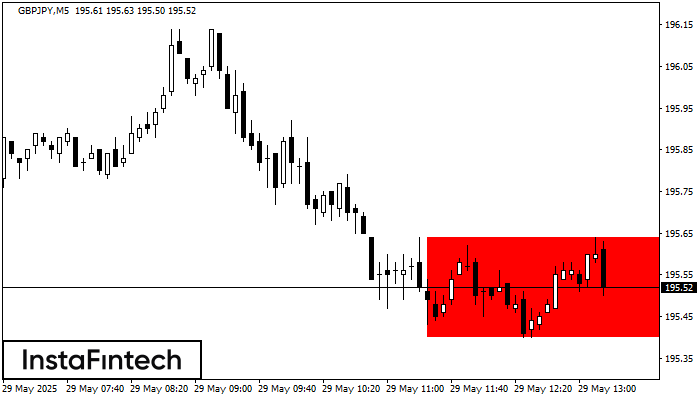
According to the chart of M5, GBPJPY formed the Bearish Rectangle. The pattern indicates a trend continuation. The upper border is 195.64, the lower border is 195.40. The signal means
The M5 and M15 time frames may have more false entry points.
Открыть график инструмента в новом окне
Double Top
сформирован 29.05 в 11:55:38 (UTC+0)
сила сигнала 1 из 5
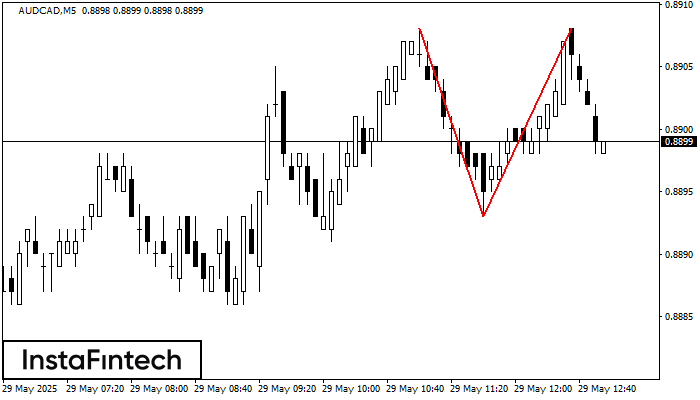
The Double Top reversal pattern has been formed on AUDCAD M5. Characteristics: the upper boundary 0.8908; the lower boundary 0.8893; the width of the pattern is 15 points. Sell trades
The M5 and M15 time frames may have more false entry points.
Открыть график инструмента в новом окне


