

Dolzarb patternlar

Двойное дно
сформирован 16.04 в 06:31:16 (UTC+0)
сила сигнала 2 из 5
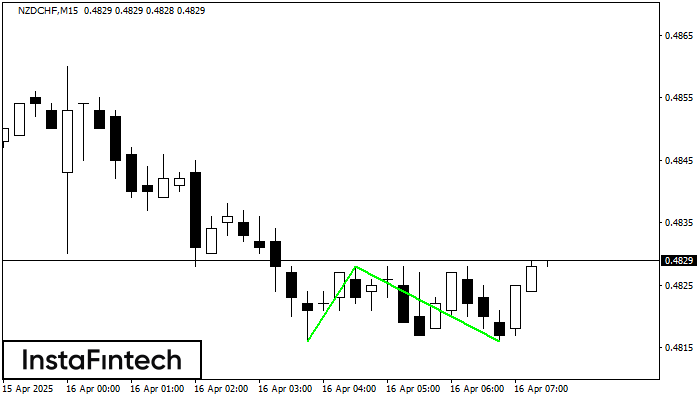
Сформирована фигура «Двойное дно» на графике NZDCHF M15. Верхняя граница 0.4828; Нижняя граница 0.4816; Ширина фигуры 12 пунктов. В случае пробоя верхней границы 0.4828 можно будет прогнозировать изменение тенденции, где ширина фигуры и будет являться расстоянием предположительного Тейк Профита.
Таймфреймы М5 и М15 могут иметь больше ложных точек входа.
Shuningdek ko'ring
- Все
- Все
- Bearish Rectangle
- Bearish Symmetrical Triangle
- Bearish Symmetrical Triangle
- Bullish Rectangle
- Double Top
- Double Top
- Triple Bottom
- Triple Bottom
- Triple Top
- Triple Top
- Все
- Все
- Покупка
- Продажа
- Все
- 1
- 2
- 3
- 4
- 5
Head and Shoulders
сформирован 17.06 в 14:30:09 (UTC+0)
сила сигнала 3 из 5
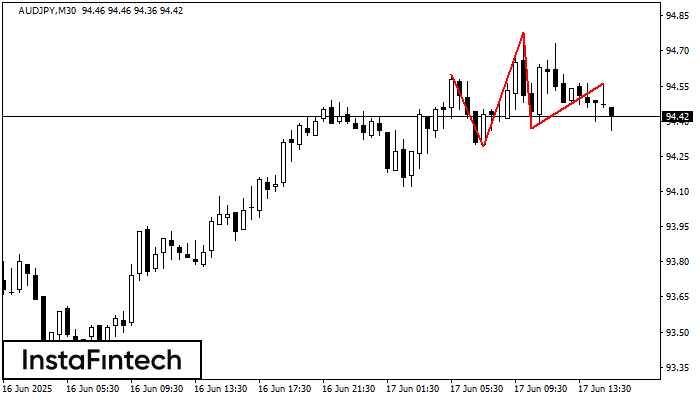
The AUDJPY M30 formed the Head and Shoulders pattern with the following features: The Head’s top is at 94.78, the Neckline and the upward angle are at 94.29/94.37. The formation
Открыть график инструмента в новом окне
Bullish Symmetrical Triangle
сформирован 17.06 в 14:05:10 (UTC+0)
сила сигнала 1 из 5
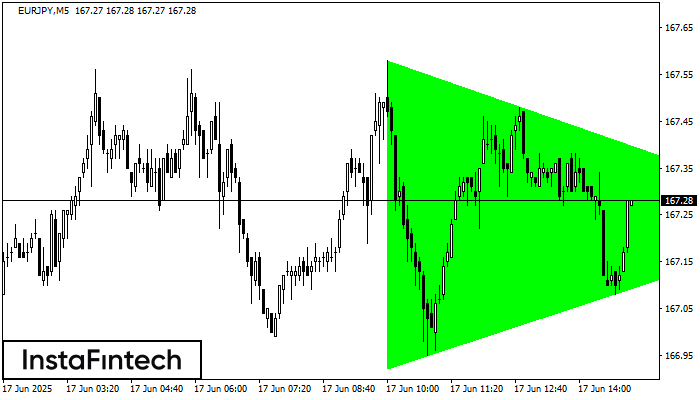
According to the chart of M5, EURJPY formed the Bullish Symmetrical Triangle pattern. The lower border of the pattern touches the coordinates 166.92/167.24 whereas the upper border goes across 167.58/167.24
The M5 and M15 time frames may have more false entry points.
Открыть график инструмента в новом окне
Double Bottom
сформирован 17.06 в 14:00:10 (UTC+0)
сила сигнала 3 из 5
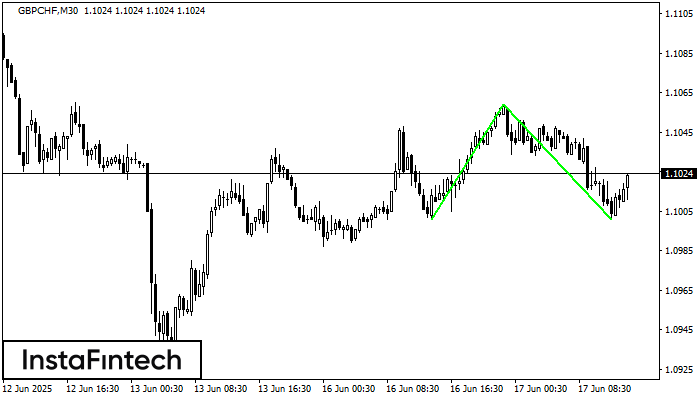
The Double Bottom pattern has been formed on GBPCHF M30. Characteristics: the support level 1.1001; the resistance level 1.1059; the width of the pattern 58 points. If the resistance level
Открыть график инструмента в новом окне


