

Dolzarb patternlar

Прямоугольник
сформирован 16.04 в 04:57:51 (UTC+0)
сила сигнала 1 из 5
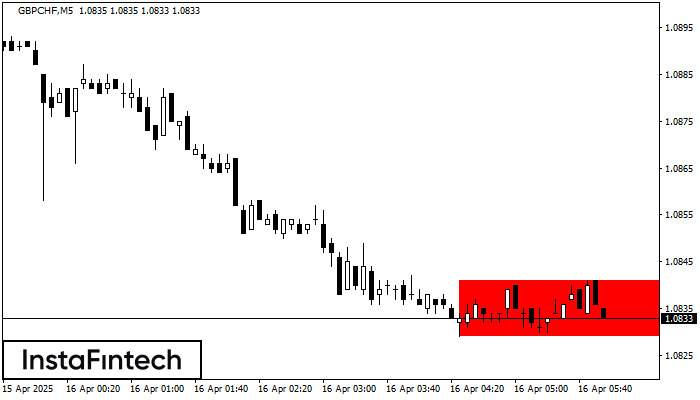
Сформирована фигура «Прямоугольник» на графике GBPCHF M5. Тип фигуры: Продолжение тренда; Границы: Верхняя 1.0841, Нижняя 1.0829; Сигнал: позиция на продажу открывается после фиксации цены ниже границы прямоугольника 1.0829.
Таймфреймы М5 и М15 могут иметь больше ложных точек входа.
- Все
- Все
- Bearish Rectangle
- Bearish Symmetrical Triangle
- Bearish Symmetrical Triangle
- Bullish Rectangle
- Double Top
- Double Top
- Triple Bottom
- Triple Bottom
- Triple Top
- Triple Top
- Все
- Все
- Покупка
- Продажа
- Все
- 1
- 2
- 3
- 4
- 5
Triple Bottom
was formed on 13.06 at 09:45:15 (UTC+0)
signal strength 2 of 5
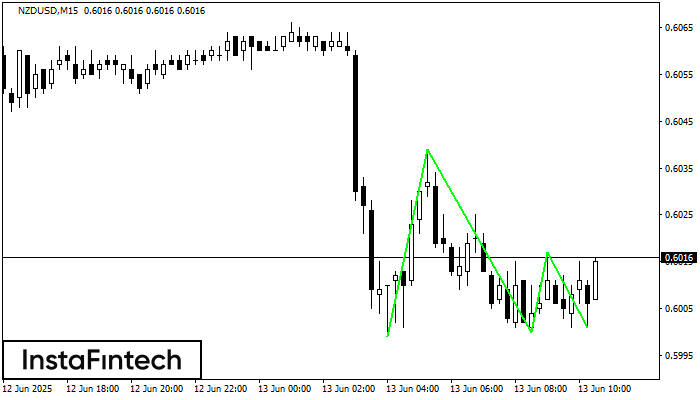
The Triple Bottom pattern has been formed on NZDUSD M15. It has the following characteristics: resistance level 0.6039/0.6017; support level 0.5999/0.6001; the width is 40 points. In the event
The M5 and M15 time frames may have more false entry points.
Open chart in a new window
Triple Top
was formed on 13.06 at 09:35:44 (UTC+0)
signal strength 1 of 5
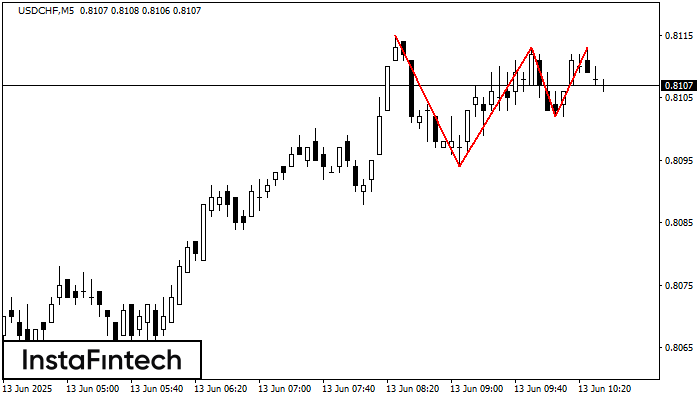
On the chart of the USDCHF M5 trading instrument, the Triple Top pattern that signals a trend change has formed. It is possible that after formation of the third peak
The M5 and M15 time frames may have more false entry points.
Open chart in a new window
Double Bottom
was formed on 13.06 at 09:30:24 (UTC+0)
signal strength 3 of 5
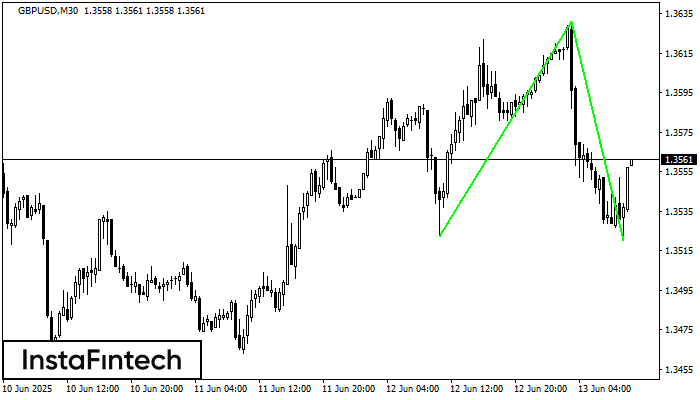
The Double Bottom pattern has been formed on GBPUSD M30. Characteristics: the support level 1.3522; the resistance level 1.3631; the width of the pattern 109 points. If the resistance level
Open chart in a new window


