

Dolzarb patternlar

Двойное дно
сформирован 14.04 в 22:00:04 (UTC+0)
сила сигнала 3 из 5
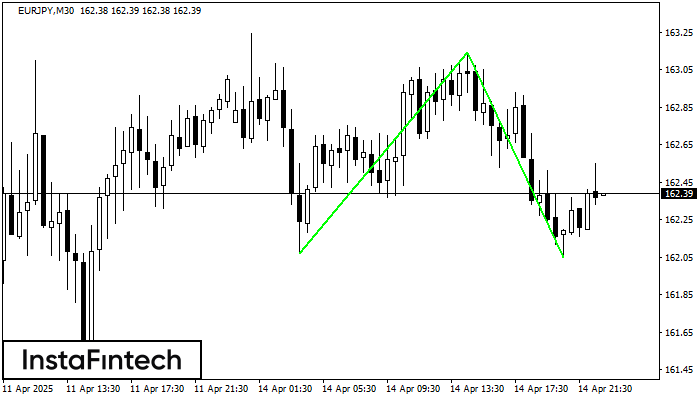
Сформирована фигура «Двойное дно» на графике EURJPY M30. Верхняя граница 163.14; Нижняя граница 162.05; Ширина фигуры 107 пунктов. В случае пробоя верхней границы 163.14 можно будет прогнозировать изменение тенденции, где ширина фигуры и будет являться расстоянием предположительного Тейк Профита.
- Все
- Все
- Bearish Rectangle
- Bearish Symmetrical Triangle
- Bearish Symmetrical Triangle
- Bullish Rectangle
- Double Top
- Double Top
- Triple Bottom
- Triple Bottom
- Triple Top
- Triple Top
- Все
- Все
- Покупка
- Продажа
- Все
- 1
- 2
- 3
- 4
- 5
Double Top
сформирован 13.06 в 08:00:29 (UTC+0)
сила сигнала 2 из 5
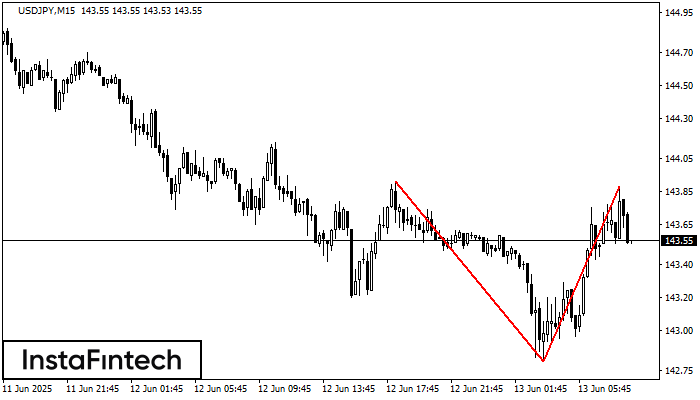
On the chart of USDJPY M15 the Double Top reversal pattern has been formed. Characteristics: the upper boundary 143.88; the lower boundary 142.81; the width of the pattern 107 points
The M5 and M15 time frames may have more false entry points.
Открыть график инструмента в новом окне
Triple Top
сформирован 13.06 в 07:45:25 (UTC+0)
сила сигнала 1 из 5
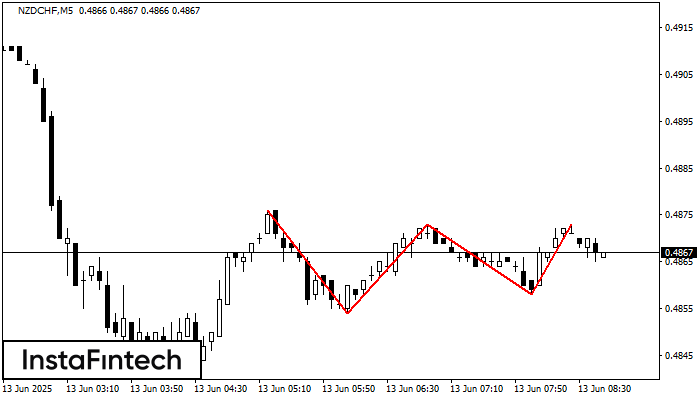
On the chart of the NZDCHF M5 trading instrument, the Triple Top pattern that signals a trend change has formed. It is possible that after formation of the third peak
The M5 and M15 time frames may have more false entry points.
Открыть график инструмента в новом окне
Triple Top
сформирован 13.06 в 07:00:39 (UTC+0)
сила сигнала 1 из 5
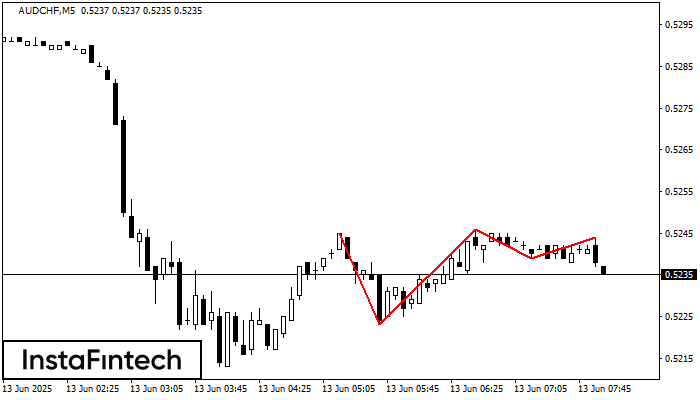
The Triple Top pattern has formed on the chart of the AUDCHF M5. Features of the pattern: borders have an ascending angle; the lower line of the pattern
The M5 and M15 time frames may have more false entry points.
Открыть график инструмента в новом окне


