

Dolzarb patternlar

Двойная вершина
сформирован 14.04 в 20:31:29 (UTC+0)
сила сигнала 2 из 5
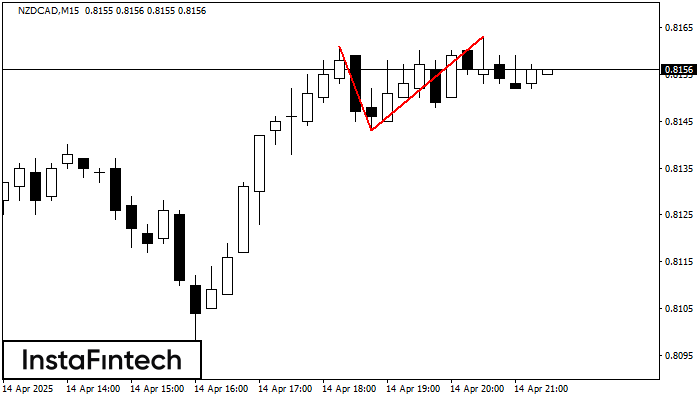
По торговому инструменту NZDCAD на M15 сформировалась фигура «Двойная вершина», которая сигнализирует нам об изменении тенденции с восходящей на нисходящую. Вероятно, что, в случае пробоя основания фигуры 0.8143, возможно дальнейшее нисходящее движение.
Таймфреймы М5 и М15 могут иметь больше ложных точек входа.
Shuningdek ko'ring
- Все
- Все
- Bearish Rectangle
- Bearish Symmetrical Triangle
- Bearish Symmetrical Triangle
- Bullish Rectangle
- Double Top
- Double Top
- Triple Bottom
- Triple Bottom
- Triple Top
- Triple Top
- Все
- Все
- Покупка
- Продажа
- Все
- 1
- 2
- 3
- 4
- 5
Double Top
was formed on 13.06 at 13:10:20 (UTC+0)
signal strength 1 of 5
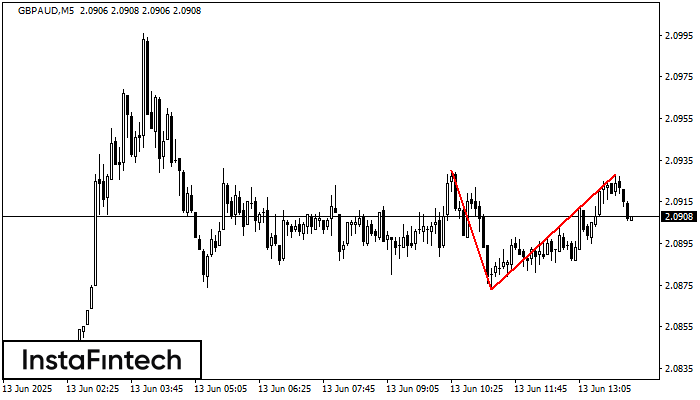
The Double Top pattern has been formed on GBPAUD M5. It signals that the trend has been changed from upwards to downwards. Probably, if the base of the pattern 2.0873
The M5 and M15 time frames may have more false entry points.
Open chart in a new window
Bullish Rectangle
was formed on 13.06 at 12:18:51 (UTC+0)
signal strength 1 of 5
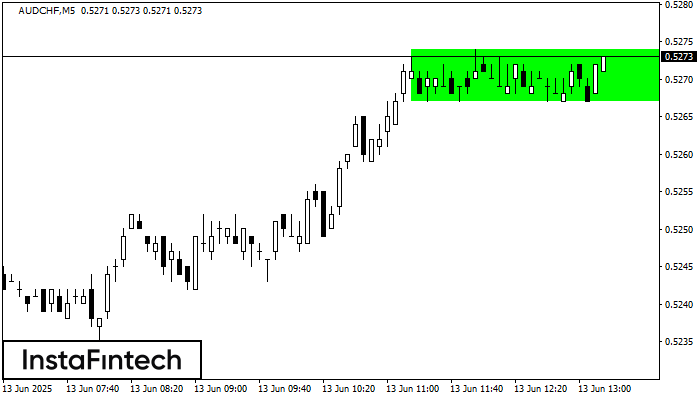
According to the chart of M5, AUDCHF formed the Bullish Rectangle. This type of a pattern indicates a trend continuation. It consists of two levels: resistance 0.5274 and support 0.5267
The M5 and M15 time frames may have more false entry points.
Open chart in a new window
Bullish Rectangle
was formed on 13.06 at 11:57:41 (UTC+0)
signal strength 1 of 5
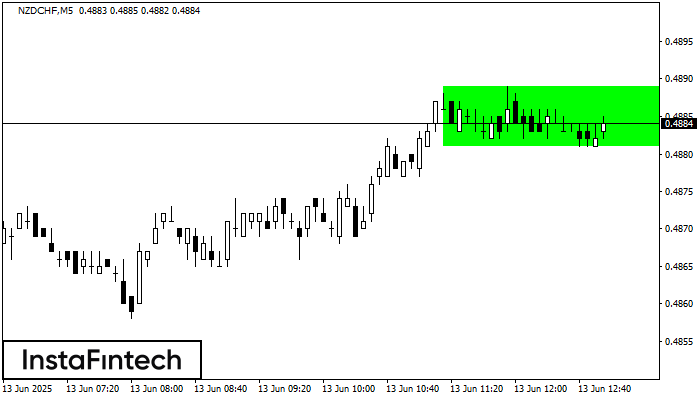
According to the chart of M5, NZDCHF formed the Bullish Rectangle. The pattern indicates a trend continuation. The upper border is 0.4889, the lower border is 0.4881. The signal means
The M5 and M15 time frames may have more false entry points.
Open chart in a new window


