

Dolzarb patternlar

Двойная вершина
сформирован 14.04 в 18:25:23 (UTC+0)
сила сигнала 1 из 5
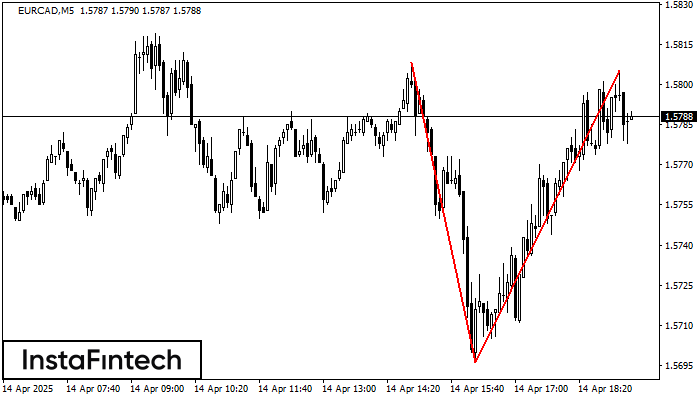
На торговом графике EURCAD M5 сформировалась разворотная фигура «Двойная вершина». Характеристика: Верхняя граница 1.5805; Нижняя граница 1.5696; Ширина фигуры 109 пунктов. Сигнал: Пробой нижней границы 1.5696 приведет к дальнейшему нисходящему движению с перспективой хода к уровню 1.5681.
Таймфреймы М5 и М15 могут иметь больше ложных точек входа.
- Все
- Все
- Bearish Rectangle
- Bearish Symmetrical Triangle
- Bearish Symmetrical Triangle
- Bullish Rectangle
- Double Top
- Double Top
- Triple Bottom
- Triple Bottom
- Triple Top
- Triple Top
- Все
- Все
- Покупка
- Продажа
- Все
- 1
- 2
- 3
- 4
- 5
Triple Bottom
сформирован 16.06 в 22:35:17 (UTC+0)
сила сигнала 1 из 5
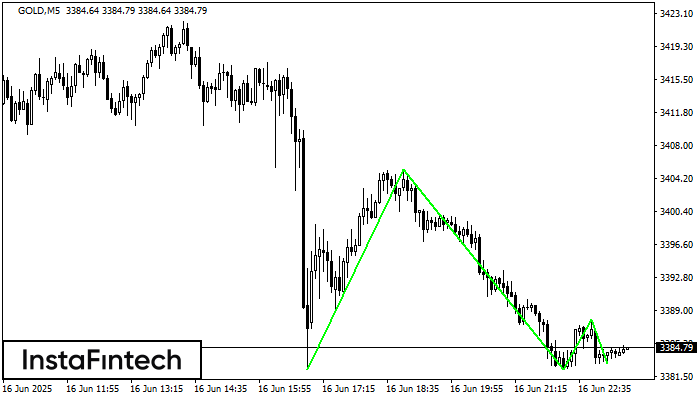
The Triple Bottom pattern has formed on the chart of the GOLD M5 trading instrument. The pattern signals a change in the trend from downwards to upwards in the case
The M5 and M15 time frames may have more false entry points.
Открыть график инструмента в новом окне
Double Bottom
сформирован 16.06 в 21:35:17 (UTC+0)
сила сигнала 1 из 5
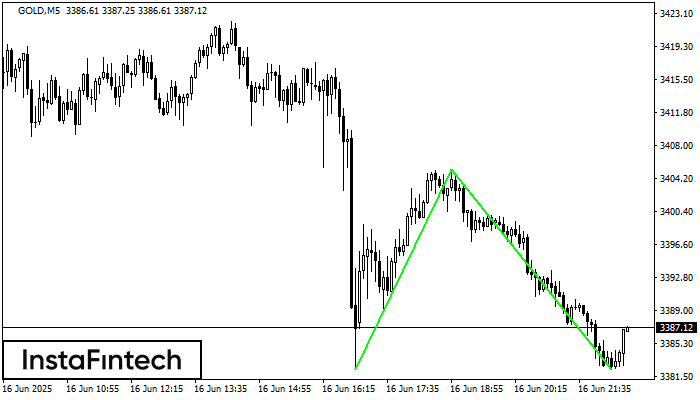
The Double Bottom pattern has been formed on GOLD M5. This formation signals a reversal of the trend from downwards to upwards. The signal is that a buy trade should
The M5 and M15 time frames may have more false entry points.
Открыть график инструмента в новом окне
Bullish Symmetrical Triangle
сформирован 16.06 в 21:29:18 (UTC+0)
сила сигнала 1 из 5
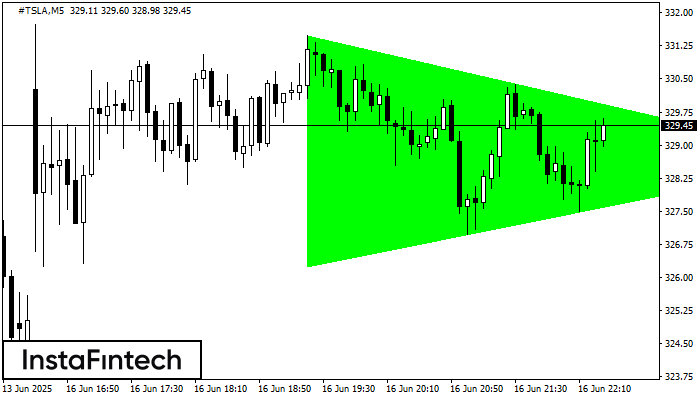
According to the chart of M5, #TSLA formed the Bullish Symmetrical Triangle pattern. The lower border of the pattern touches the coordinates 326.25/328.67 whereas the upper border goes across 331.48/328.67
The M5 and M15 time frames may have more false entry points.
Открыть график инструмента в новом окне


