

Dolzarb patternlar

Тройная вершина
сформирован 14.04 в 18:00:11 (UTC+0)
сила сигнала 4 из 5
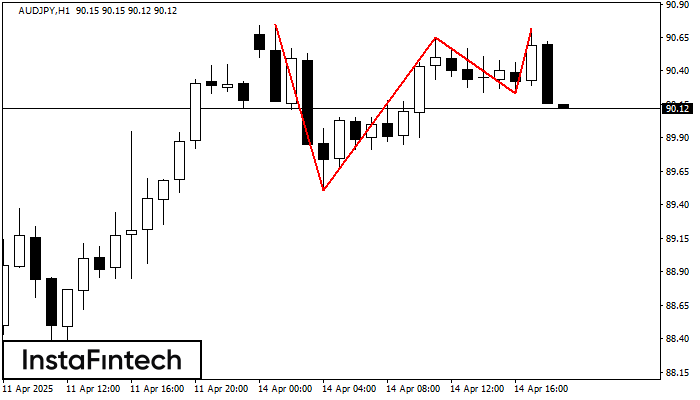
На графике AUDJPY H1 образовалась фигура «Тройная вершина». Данная фигура относится к типу разворотных и имеет характеристику: Верхняя граница 90.75/90.72; Нижняя граница 89.51/90.23; Ширина фигуры 42 пунктов. Прогноз: В случае пробоя нижней границы 89.51 вероятно дальнейшее нисходящее движение к уровню 90.25.
Shuningdek ko'ring
- Все
- Все
- Bearish Rectangle
- Bearish Symmetrical Triangle
- Bearish Symmetrical Triangle
- Bullish Rectangle
- Double Top
- Double Top
- Triple Bottom
- Triple Bottom
- Triple Top
- Triple Top
- Все
- Все
- Покупка
- Продажа
- Все
- 1
- 2
- 3
- 4
- 5
Head and Shoulders
сформирован 06.06 в 15:59:50 (UTC+0)
сила сигнала 4 из 5
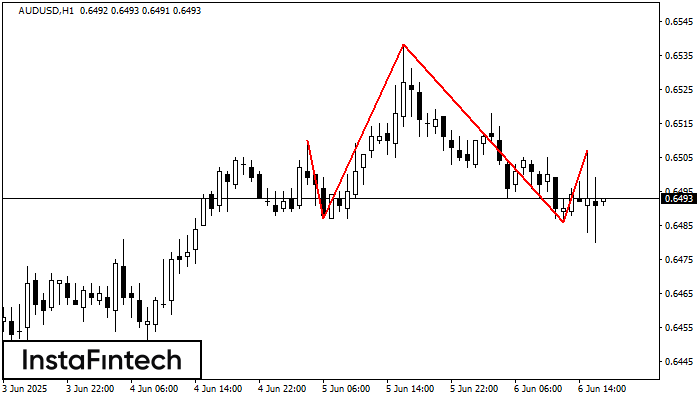
The technical pattern called Head and Shoulders has appeared on the chart of AUDUSD H1. There are weighty reasons to suggest that the price will surpass the Neckline 0.6487/0.6486 after
Открыть график инструмента в новом окне
Double Bottom
сформирован 06.06 в 15:59:41 (UTC+0)
сила сигнала 1 из 5
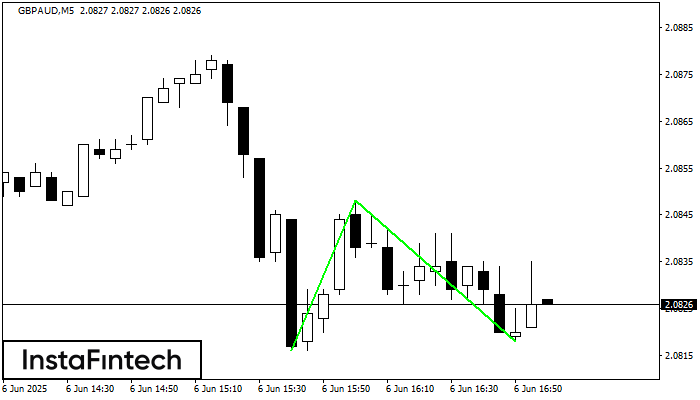
The Double Bottom pattern has been formed on GBPAUD M5; the upper boundary is 2.0848; the lower boundary is 2.0818. The width of the pattern is 32 points. In case
The M5 and M15 time frames may have more false entry points.
Открыть график инструмента в новом окне
Triple Top
сформирован 06.06 в 14:30:03 (UTC+0)
сила сигнала 3 из 5
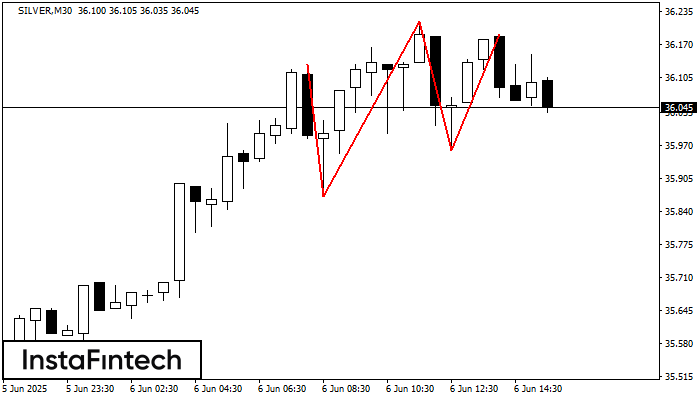
The Triple Top pattern has formed on the chart of the SILVER M30. Features of the pattern: borders have an ascending angle; the lower line of the pattern
Открыть график инструмента в новом окне


