

Dolzarb patternlar

Прямоугольник
сформирован 14.04 в 13:29:26 (UTC+0)
сила сигнала 2 из 5
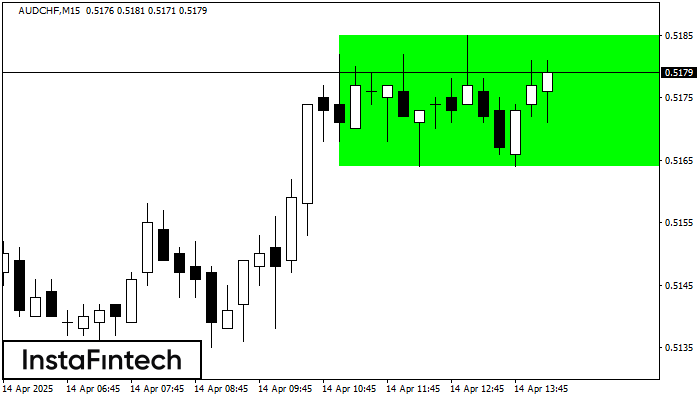
По торговому инструменту AUDCHF на M15 сформировалась фигура продолжения тренда - «Прямоугольник». Фигура имеет границы: Нижняя 0.5164; Верхняя 0.5185. В случае пробоя верхней границы вероятно дальнейшее движение в сторону тренда.
Таймфреймы М5 и М15 могут иметь больше ложных точек входа.
- Все
- Все
- Bearish Rectangle
- Bearish Symmetrical Triangle
- Bearish Symmetrical Triangle
- Bullish Rectangle
- Double Top
- Double Top
- Triple Bottom
- Triple Bottom
- Triple Top
- Triple Top
- Все
- Все
- Покупка
- Продажа
- Все
- 1
- 2
- 3
- 4
- 5
Double Bottom
сформирован 17.06 в 02:50:34 (UTC+0)
сила сигнала 1 из 5
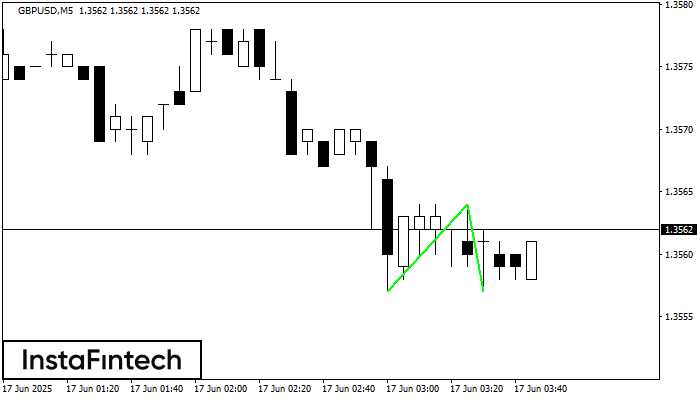
The Double Bottom pattern has been formed on GBPUSD M5. This formation signals a reversal of the trend from downwards to upwards. The signal is that a buy trade should
The M5 and M15 time frames may have more false entry points.
Открыть график инструмента в новом окне
Bearish Rectangle
сформирован 17.06 в 02:50:21 (UTC+0)
сила сигнала 2 из 5
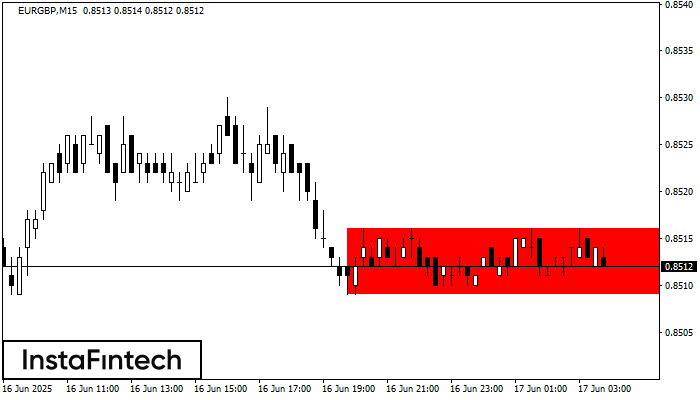
According to the chart of M15, EURGBP formed the Bearish Rectangle. This type of a pattern indicates a trend continuation. It consists of two levels: resistance 0.8516 - 0.0000
The M5 and M15 time frames may have more false entry points.
Открыть график инструмента в новом окне
Bullish Symmetrical Triangle
сформирован 17.06 в 01:31:06 (UTC+0)
сила сигнала 1 из 5
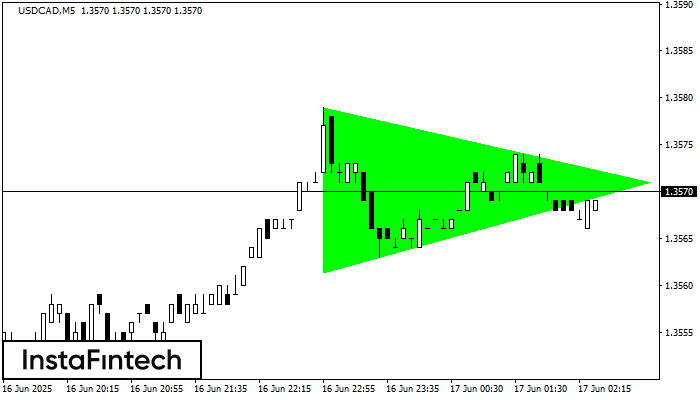
According to the chart of M5, USDCAD formed the Bullish Symmetrical Triangle pattern. The lower border of the pattern touches the coordinates 1.3561/1.3571 whereas the upper border goes across 1.3579/1.3571
The M5 and M15 time frames may have more false entry points.
Открыть график инструмента в новом окне


