

Dolzarb patternlar

Бычий симметричный треугольник
сформирован 14.04 в 12:56:06 (UTC+0)
сила сигнала 1 из 5

По NZDJPY на M5 фигура «Бычий симметричный треугольник». Характеристика: Фигура продолжения тренда; Координаты границ – верхняя 84.17, нижняя 83.88. Проекция ширины фигуры 29 пунктов. Прогноз: В случае пробоя верхней границы 84.17 цена, вероятнее всего, продолжит движение к 84.15.
Таймфреймы М5 и М15 могут иметь больше ложных точек входа.
- Все
- Все
- Bearish Rectangle
- Bearish Symmetrical Triangle
- Bearish Symmetrical Triangle
- Bullish Rectangle
- Double Top
- Double Top
- Triple Bottom
- Triple Bottom
- Triple Top
- Triple Top
- Все
- Все
- Покупка
- Продажа
- Все
- 1
- 2
- 3
- 4
- 5
Bullish Symmetrical Triangle
was formed on 11.06 at 00:21:28 (UTC+0)
signal strength 1 of 5
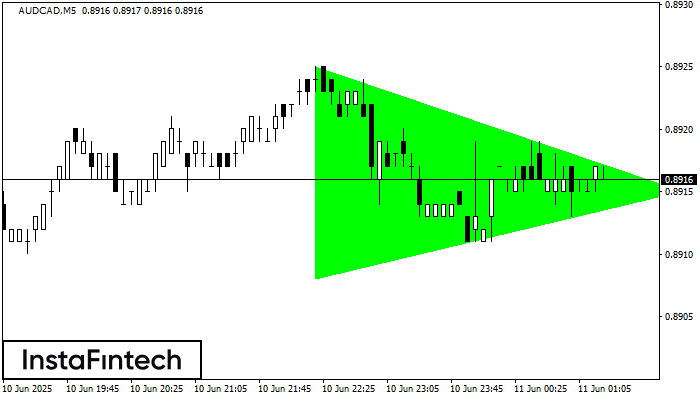
According to the chart of M5, AUDCAD formed the Bullish Symmetrical Triangle pattern. Description: This is the pattern of a trend continuation. 0.8925 and 0.8908 are the coordinates
The M5 and M15 time frames may have more false entry points.
Open chart in a new window
Double Bottom
was formed on 11.06 at 00:00:21 (UTC+0)
signal strength 2 of 5
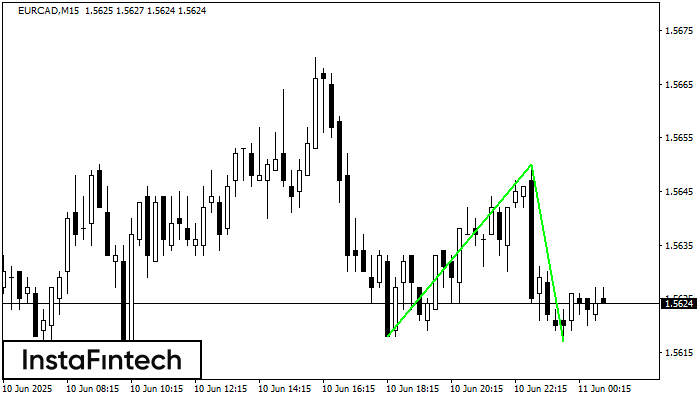
The Double Bottom pattern has been formed on EURCAD M15; the upper boundary is 1.5650; the lower boundary is 1.5617. The width of the pattern is 32 points. In case
The M5 and M15 time frames may have more false entry points.
Open chart in a new window
Head and Shoulders
was formed on 10.06 at 23:26:25 (UTC+0)
signal strength 1 of 5
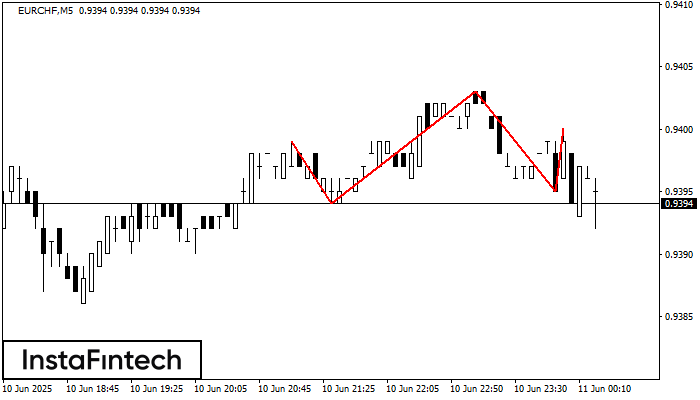
The technical pattern called Head and Shoulders has appeared on the chart of EURCHF M5. There are weighty reasons to suggest that the price will surpass the Neckline 0.9394/0.9395 after
The M5 and M15 time frames may have more false entry points.
Open chart in a new window


