

Dolzarb patternlar

Двойная вершина
сформирован 14.04 в 12:45:36 (UTC+0)
сила сигнала 2 из 5
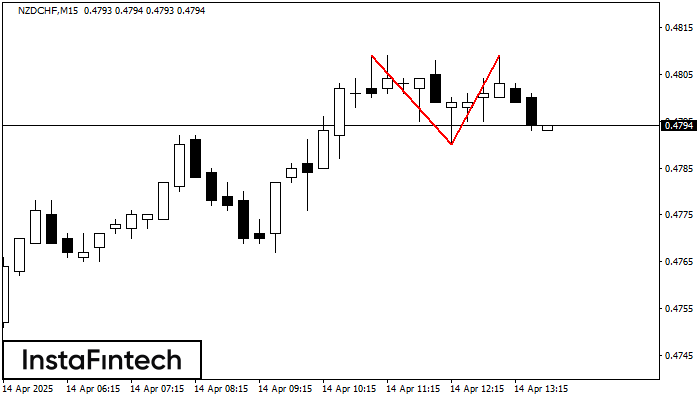
По торговому инструменту NZDCHF на M15 сформировалась фигура «Двойная вершина», которая сигнализирует нам об изменении тенденции с восходящей на нисходящую. Вероятно, что, в случае пробоя основания фигуры 0.4790, возможно дальнейшее нисходящее движение.
Таймфреймы М5 и М15 могут иметь больше ложных точек входа.
- Все
- Все
- Bearish Rectangle
- Bearish Symmetrical Triangle
- Bearish Symmetrical Triangle
- Bullish Rectangle
- Double Top
- Double Top
- Triple Bottom
- Triple Bottom
- Triple Top
- Triple Top
- Все
- Все
- Покупка
- Продажа
- Все
- 1
- 2
- 3
- 4
- 5
Bullish Rectangle
was formed on 09.06 at 08:45:29 (UTC+0)
signal strength 2 of 5
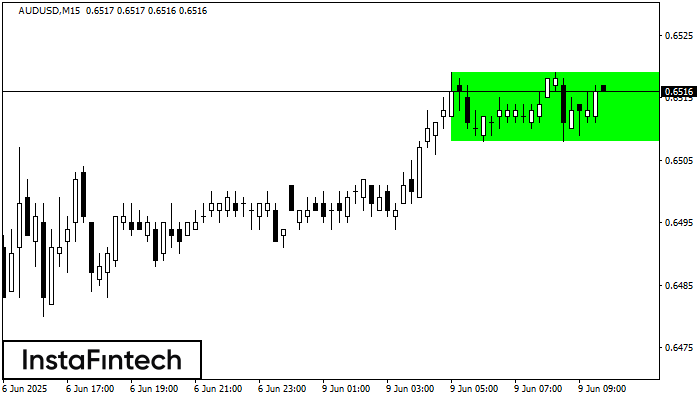
According to the chart of M15, AUDUSD formed the Bullish Rectangle which is a pattern of a trend continuation. The pattern is contained within the following borders: the lower border
The M5 and M15 time frames may have more false entry points.
Open chart in a new window
Head and Shoulders
was formed on 09.06 at 08:30:24 (UTC+0)
signal strength 3 of 5
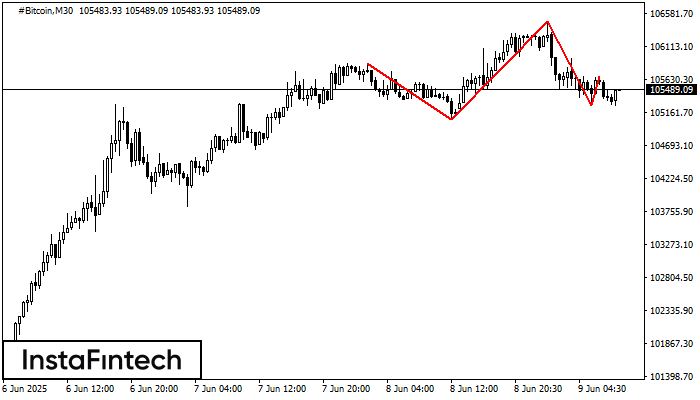
According to the chart of M30, #Bitcoin formed the Head and Shoulders pattern. The Head’s top is set at 106466.59 while the median line of the Neck is found
Open chart in a new window
Double Bottom
was formed on 09.06 at 08:30:24 (UTC+0)
signal strength 2 of 5
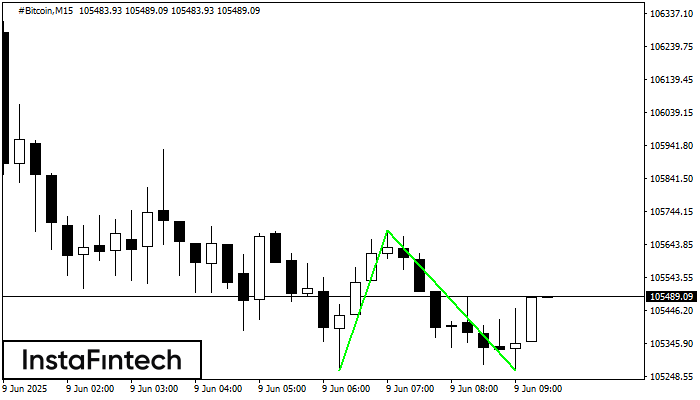
The Double Bottom pattern has been formed on #Bitcoin M15. Characteristics: the support level 105266.00; the resistance level 105685.24; the width of the pattern 41924 points. If the resistance level
The M5 and M15 time frames may have more false entry points.
Open chart in a new window


