

Dolzarb patternlar

Медвежий симметричный треугольник
сформирован 10.04 в 11:46:39 (UTC+0)
сила сигнала 1 из 5
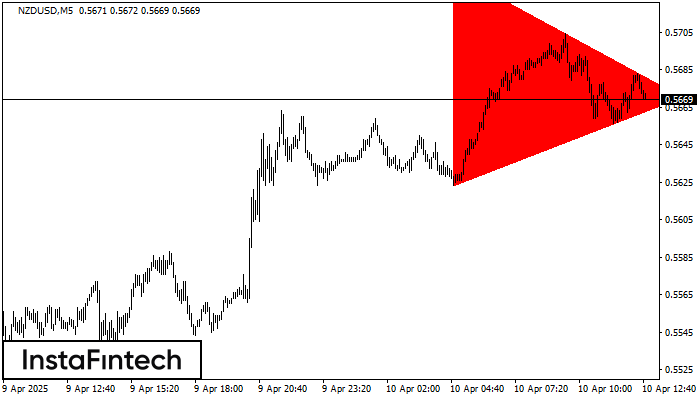
На графике NZDUSD на M5 сформировалась фигура «Медвежий симметричный треугольник». Торговые рекомендации: Пробой нижней границы 0.5623 с большой долей вероятности приведет к продолжению нисходящего тренда.
Таймфреймы М5 и М15 могут иметь больше ложных точек входа.
- Все
- Все
- Bearish Rectangle
- Bearish Symmetrical Triangle
- Bearish Symmetrical Triangle
- Bullish Rectangle
- Double Top
- Double Top
- Triple Bottom
- Triple Bottom
- Triple Top
- Triple Top
- Все
- Все
- Покупка
- Продажа
- Все
- 1
- 2
- 3
- 4
- 5
Bullish Rectangle
сформирован 23.05 в 11:19:11 (UTC+0)
сила сигнала 4 из 5
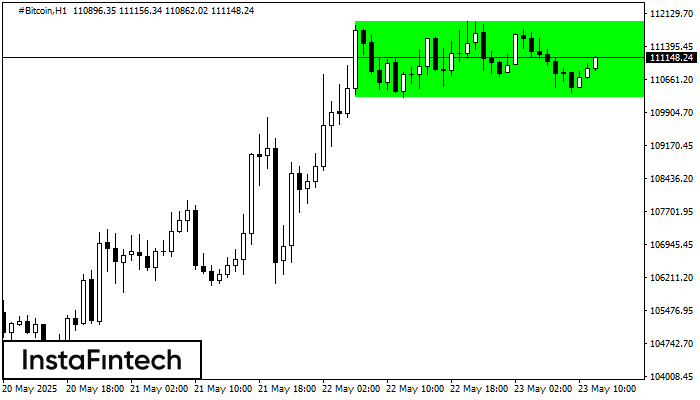
According to the chart of H1, #Bitcoin formed the Bullish Rectangle which is a pattern of a trend continuation. The pattern is contained within the following borders: the lower border
Открыть график инструмента в новом окне
Double Top
сформирован 23.05 в 10:49:51 (UTC+0)
сила сигнала 1 из 5
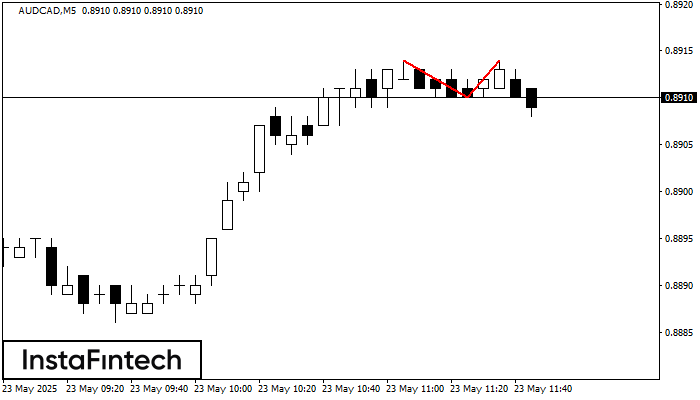
The Double Top pattern has been formed on AUDCAD M5. It signals that the trend has been changed from upwards to downwards. Probably, if the base of the pattern 0.8910
The M5 and M15 time frames may have more false entry points.
Открыть график инструмента в новом окне
Double Bottom
сформирован 23.05 в 09:29:51 (UTC+0)
сила сигнала 2 из 5
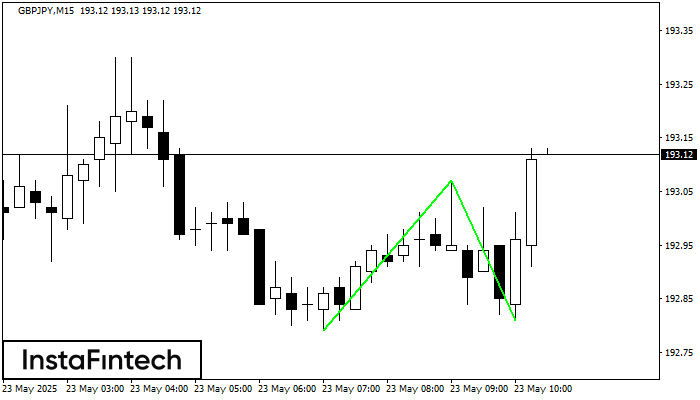
The Double Bottom pattern has been formed on GBPJPY M15. Characteristics: the support level 192.79; the resistance level 193.07; the width of the pattern 28 points. If the resistance level
The M5 and M15 time frames may have more false entry points.
Открыть график инструмента в новом окне


