

Dolzarb patternlar

Двойная вершина
сформирован 09.04 в 22:10:30 (UTC+0)
сила сигнала 1 из 5
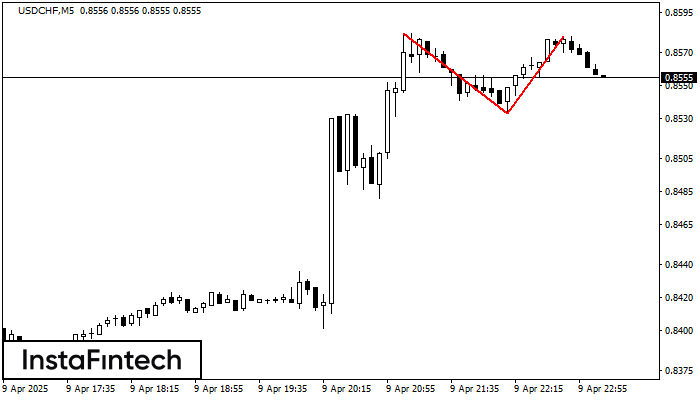
На торговом графике USDCHF M5 сформировалась разворотная фигура «Двойная вершина». Характеристика: Верхняя граница 0.8580; Нижняя граница 0.8533; Ширина фигуры 47 пунктов. Сигнал: Пробой нижней границы 0.8533 приведет к дальнейшему нисходящему движению с перспективой хода к уровню 0.8518.
Таймфреймы М5 и М15 могут иметь больше ложных точек входа.
Shuningdek ko'ring
- Все
- Все
- Bearish Rectangle
- Bearish Symmetrical Triangle
- Bearish Symmetrical Triangle
- Bullish Rectangle
- Double Top
- Double Top
- Triple Bottom
- Triple Bottom
- Triple Top
- Triple Top
- Все
- Все
- Покупка
- Продажа
- Все
- 1
- 2
- 3
- 4
- 5
Inverse Head and Shoulder
was formed on 30.05 at 04:40:07 (UTC+0)
signal strength 1 of 5
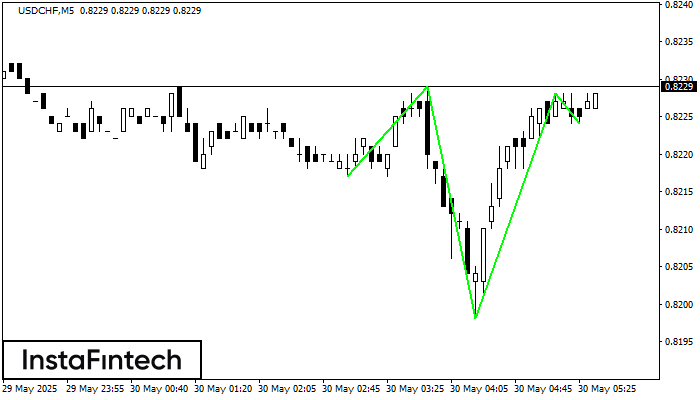
According to M5, USDCHF is shaping the technical pattern – the Inverse Head and Shoulder. In case the Neckline 0.8229/0.8228 is broken out, the instrument is likely to move toward
The M5 and M15 time frames may have more false entry points.
Open chart in a new window
Bullish Rectangle
was formed on 30.05 at 04:38:57 (UTC+0)
signal strength 1 of 5
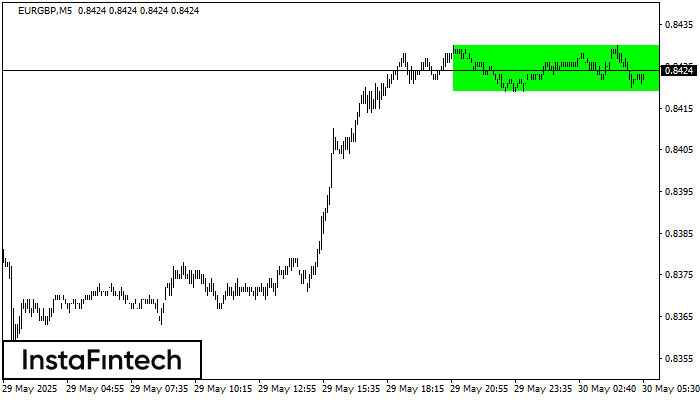
According to the chart of M5, EURGBP formed the Bullish Rectangle. The pattern indicates a trend continuation. The upper border is 0.8430, the lower border is 0.8419. The signal means
The M5 and M15 time frames may have more false entry points.
Open chart in a new window
Bearish Rectangle
was formed on 30.05 at 04:32:51 (UTC+0)
signal strength 1 of 5
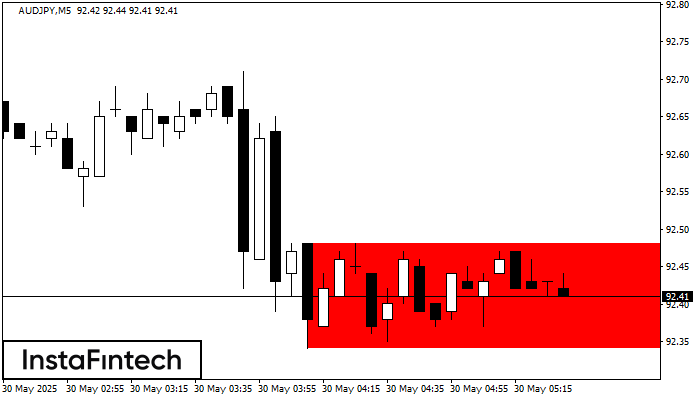
According to the chart of M5, AUDJPY formed the Bearish Rectangle. This type of a pattern indicates a trend continuation. It consists of two levels: resistance 92.48 - 0.00
The M5 and M15 time frames may have more false entry points.
Open chart in a new window


