

Dolzarb patternlar

Двойное дно
сформирован 08.04 в 04:50:18 (UTC+0)
сила сигнала 1 из 5
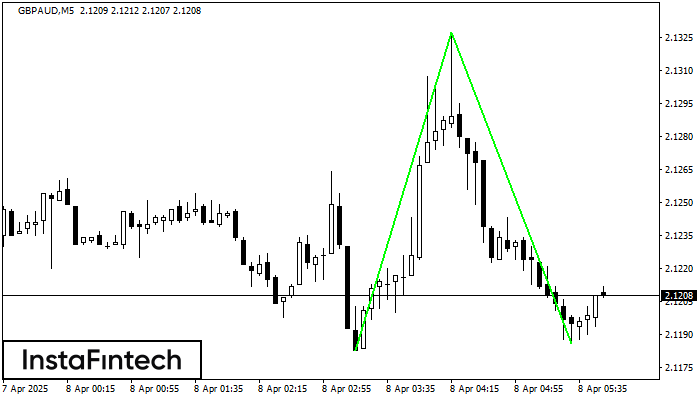
Сформирована фигура «Двойное дно» на графике GBPAUD M5. Верхняя граница 2.1327; Нижняя граница 2.1186; Ширина фигуры 144 пунктов. В случае пробоя верхней границы 2.1327 можно будет прогнозировать изменение тенденции, где ширина фигуры и будет являться расстоянием предположительного Тейк Профита.
Таймфреймы М5 и М15 могут иметь больше ложных точек входа.
Shuningdek ko'ring
- Все
- Все
- Bearish Rectangle
- Bearish Symmetrical Triangle
- Bearish Symmetrical Triangle
- Bullish Rectangle
- Double Top
- Double Top
- Triple Bottom
- Triple Bottom
- Triple Top
- Triple Top
- Все
- Все
- Покупка
- Продажа
- Все
- 1
- 2
- 3
- 4
- 5
Head and Shoulders
сформирован 10.06 в 07:59:55 (UTC+0)
сила сигнала 3 из 5
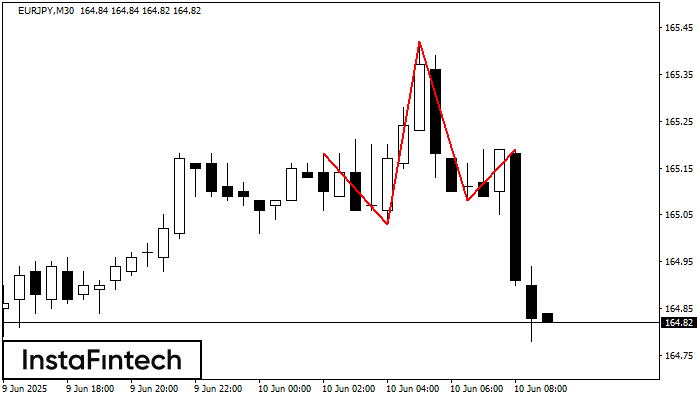
The technical pattern called Head and Shoulders has appeared on the chart of EURJPY M30. There are weighty reasons to suggest that the price will surpass the Neckline 165.03/165.08 after
Открыть график инструмента в новом окне
Head and Shoulders
сформирован 10.06 в 06:45:33 (UTC+0)
сила сигнала 2 из 5
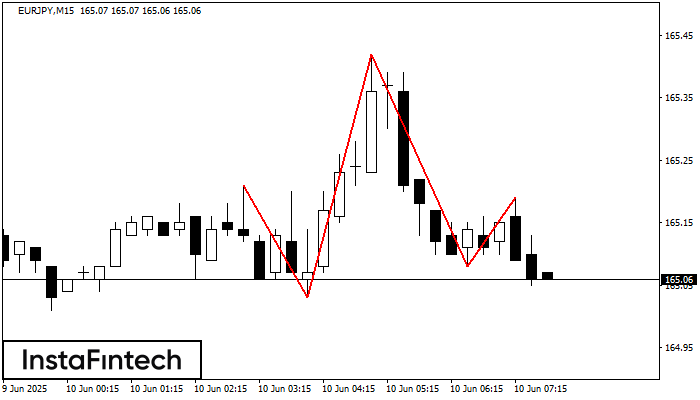
The technical pattern called Head and Shoulders has appeared on the chart of EURJPY M15. There are weighty reasons to suggest that the price will surpass the Neckline 165.03/165.08 after
The M5 and M15 time frames may have more false entry points.
Открыть график инструмента в новом окне
Triple Bottom
сформирован 10.06 в 06:35:10 (UTC+0)
сила сигнала 1 из 5
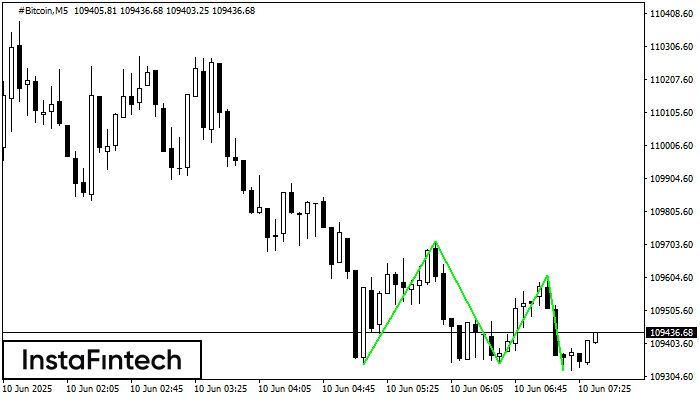
The Triple Bottom pattern has formed on the chart of the #Bitcoin M5 trading instrument. The pattern signals a change in the trend from downwards to upwards in the case
The M5 and M15 time frames may have more false entry points.
Открыть график инструмента в новом окне


