

Dolzarb patternlar

Двойное дно
сформирован 08.04 в 00:00:11 (UTC+0)
сила сигнала 4 из 5
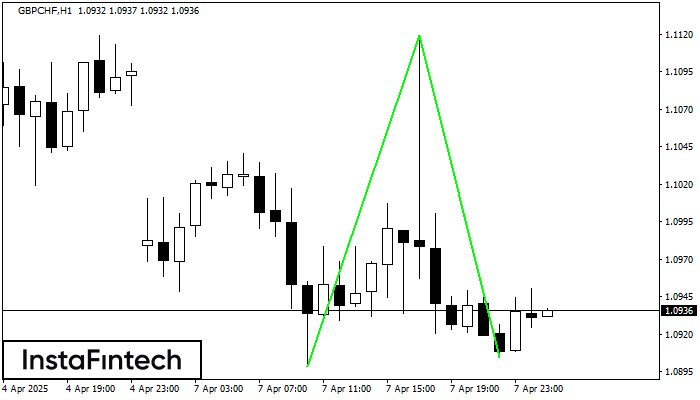
Сформирована фигура «Двойное дно» на графике GBPCHF H1. Верхняя граница 1.1119; Нижняя граница 1.0904; Ширина фигуры 221 пунктов. В случае пробоя верхней границы 1.1119 можно будет прогнозировать изменение тенденции, где ширина фигуры и будет являться расстоянием предположительного Тейк Профита.
- Все
- Все
- Bearish Rectangle
- Bearish Symmetrical Triangle
- Bearish Symmetrical Triangle
- Bullish Rectangle
- Double Top
- Double Top
- Triple Bottom
- Triple Bottom
- Triple Top
- Triple Top
- Все
- Все
- Покупка
- Продажа
- Все
- 1
- 2
- 3
- 4
- 5
Double Top
сформирован 02.06 в 14:54:52 (UTC+0)
сила сигнала 1 из 5
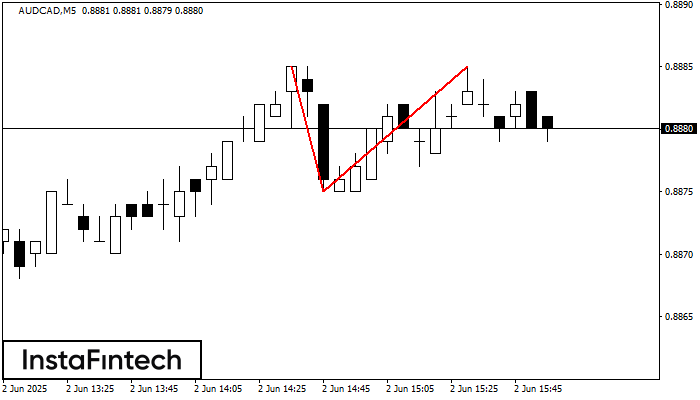
On the chart of AUDCAD M5 the Double Top reversal pattern has been formed. Characteristics: the upper boundary 0.8885; the lower boundary 0.8875; the width of the pattern 10 points
The M5 and M15 time frames may have more false entry points.
Открыть график инструмента в новом окне
Bearish pennant
сформирован 02.06 в 14:45:11 (UTC+0)
сила сигнала 4 из 5
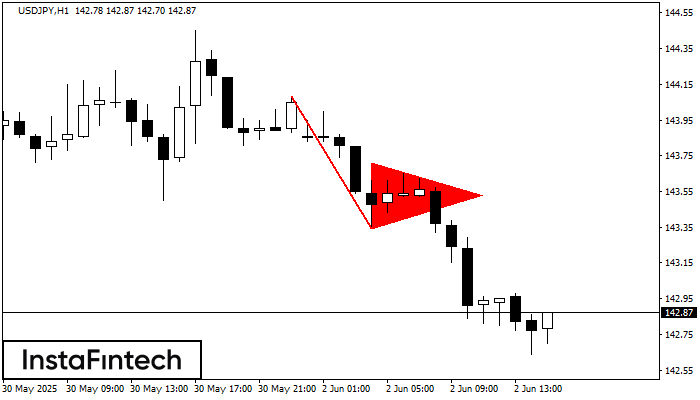
The Bearish pennant pattern has formed on the USDJPY H1 chart. It signals potential continuation of the existing trend. Specifications: the pattern’s bottom has the coordinate of 143.34; the projection
Открыть график инструмента в новом окне
Bullish Rectangle
сформирован 02.06 в 14:35:19 (UTC+0)
сила сигнала 2 из 5
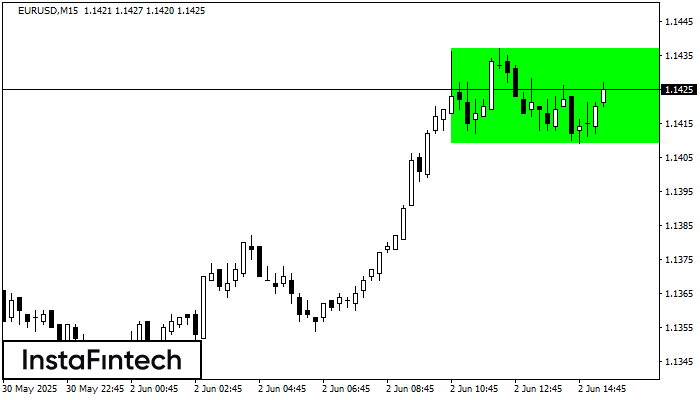
According to the chart of M15, EURUSD formed the Bullish Rectangle which is a pattern of a trend continuation. The pattern is contained within the following borders: the lower border
The M5 and M15 time frames may have more false entry points.
Открыть график инструмента в новом окне


