

Dolzarb patternlar

Двойное дно
сформирован 07.04 в 18:30:12 (UTC+0)
сила сигнала 1 из 5

Сформирована фигура «Двойное дно» на графике #AAPL M5. Данное формирование сигнализирует об изменении тенденции с нисходящего на восходящее движение. Сигнал: Торговую позицию на покупку следует открывать после пробоя верхней границы фигуры 180.32, где перспектива будущего хода будет являться шириной текущей фигуры - 444 пунктов.
Таймфреймы М5 и М15 могут иметь больше ложных точек входа.
- Все
- Все
- Bearish Rectangle
- Bearish Symmetrical Triangle
- Bearish Symmetrical Triangle
- Bullish Rectangle
- Double Top
- Double Top
- Triple Bottom
- Triple Bottom
- Triple Top
- Triple Top
- Все
- Все
- Покупка
- Продажа
- Все
- 1
- 2
- 3
- 4
- 5
Bearish Symmetrical Triangle
сформирован 12.06 в 07:39:15 (UTC+0)
сила сигнала 1 из 5
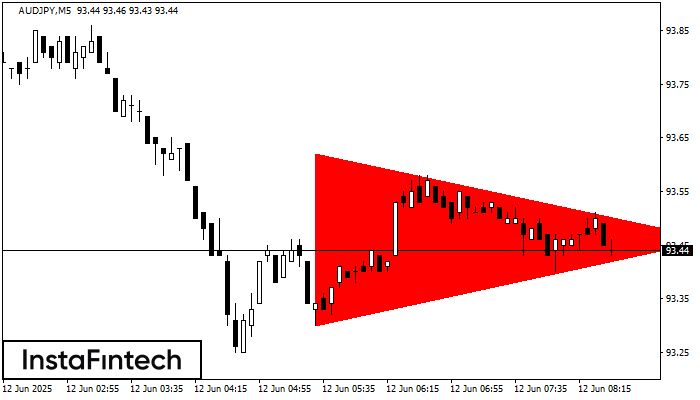
According to the chart of M5, AUDJPY formed the Bearish Symmetrical Triangle pattern. Trading recommendations: A breach of the lower border 93.30 is likely to encourage a continuation
The M5 and M15 time frames may have more false entry points.
Открыть график инструмента в новом окне
Bullish Symmetrical Triangle
сформирован 12.06 в 06:45:29 (UTC+0)
сила сигнала 1 из 5
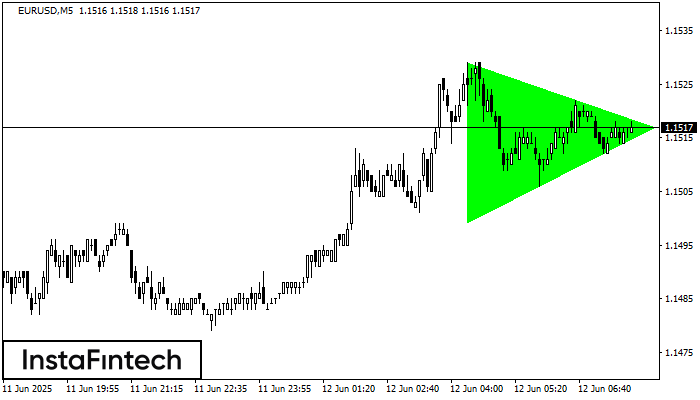
According to the chart of M5, EURUSD formed the Bullish Symmetrical Triangle pattern. The lower border of the pattern touches the coordinates 1.1499/1.1517 whereas the upper border goes across 1.1529/1.1517
The M5 and M15 time frames may have more false entry points.
Открыть график инструмента в новом окне
Bearish Symmetrical Triangle
сформирован 12.06 в 06:05:41 (UTC+0)
сила сигнала 1 из 5
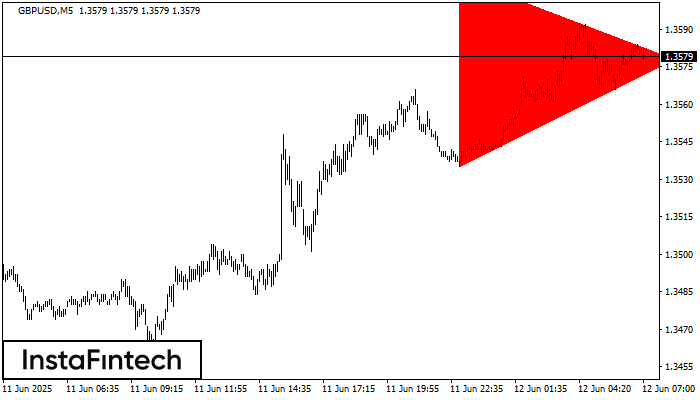
According to the chart of M5, GBPUSD formed the Bearish Symmetrical Triangle pattern. Trading recommendations: A breach of the lower border 1.3535 is likely to encourage a continuation
The M5 and M15 time frames may have more false entry points.
Открыть график инструмента в новом окне


