

Dolzarb patternlar

Медвежий вымпел
сформирован 07.04 в 00:30:13 (UTC+0)
сила сигнала 3 из 5
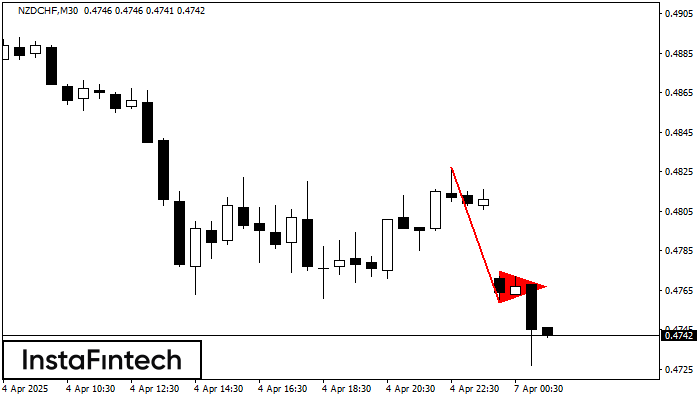
На графике NZDCHF M30 сформировалась фигура «Медвежий вымпел», которая сигнализирует о возможном продолжении тренда. Характеристика: основание фигуры имеет координаты 0.4759; проекция высоты флагштока равна 68 пунктов. В случае если цена преодолеет основание фигуры 0.4759, то ожидается продолжение нисходящего тренда на уровень 0.4729 пунктов.
- Все
- Все
- Bearish Rectangle
- Bearish Symmetrical Triangle
- Bearish Symmetrical Triangle
- Bullish Rectangle
- Double Top
- Double Top
- Triple Bottom
- Triple Bottom
- Triple Top
- Triple Top
- Все
- Все
- Покупка
- Продажа
- Все
- 1
- 2
- 3
- 4
- 5
Bearish Rectangle
сформирован 04.06 в 00:07:32 (UTC+0)
сила сигнала 1 из 5
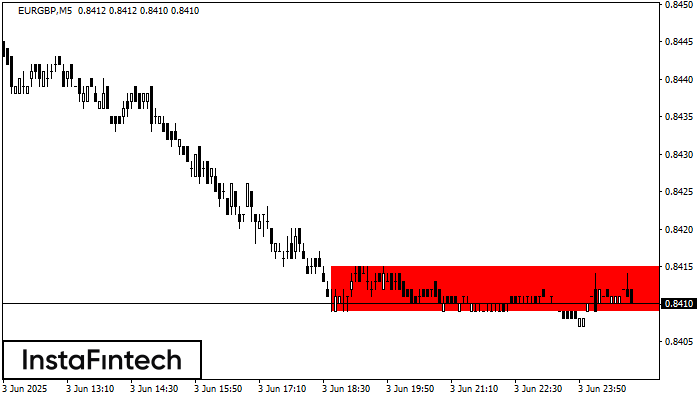
According to the chart of M5, EURGBP formed the Bearish Rectangle which is a pattern of a trend continuation. The pattern is contained within the following borders: lower border 0.8409
The M5 and M15 time frames may have more false entry points.
Открыть график инструмента в новом окне
Bullish Rectangle
сформирован 03.06 в 23:47:07 (UTC+0)
сила сигнала 1 из 5
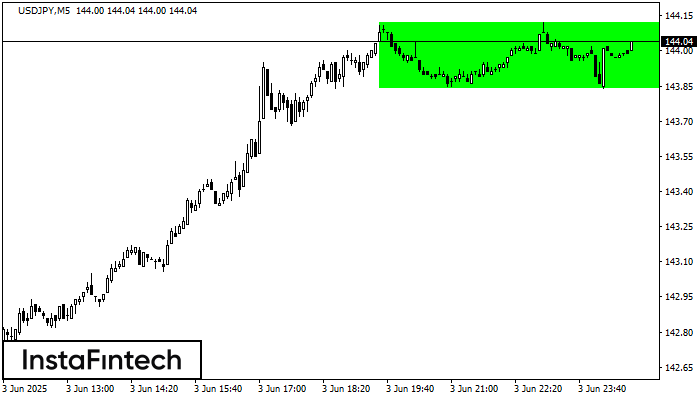
According to the chart of M5, USDJPY formed the Bullish Rectangle. This type of a pattern indicates a trend continuation. It consists of two levels: resistance 144.12 and support 143.84
The M5 and M15 time frames may have more false entry points.
Открыть график инструмента в новом окне
Bullish Rectangle
сформирован 03.06 в 23:46:54 (UTC+0)
сила сигнала 2 из 5
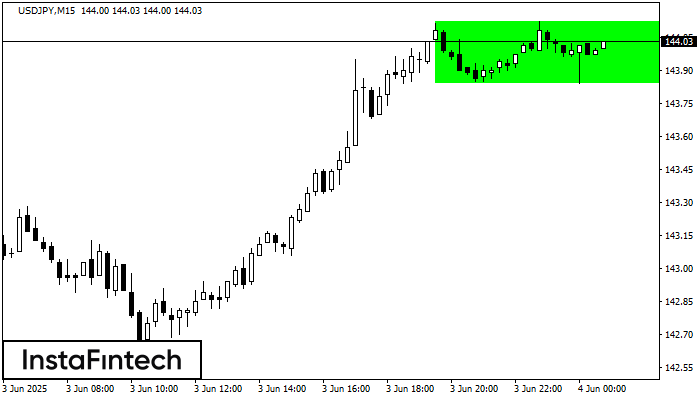
According to the chart of M15, USDJPY formed the Bullish Rectangle which is a pattern of a trend continuation. The pattern is contained within the following borders: the lower border
The M5 and M15 time frames may have more false entry points.
Открыть график инструмента в новом окне


