

Dolzarb patternlar

Прямоугольник
сформирован 06.04 в 23:00:32 (UTC+0)
сила сигнала 3 из 5
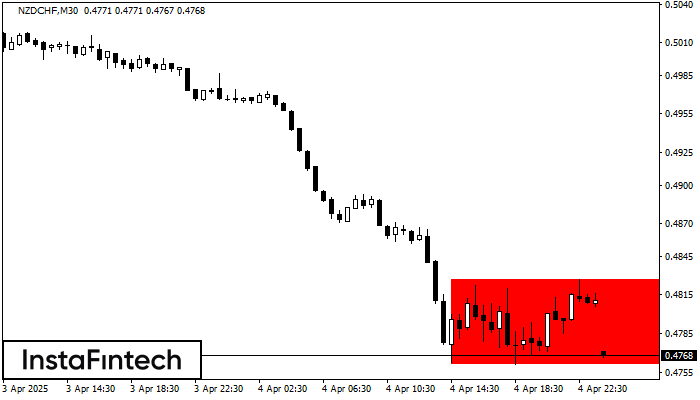
Сформирована фигура «Прямоугольник» на графике NZDCHF M30. Тип фигуры: Продолжение тренда; Границы: Верхняя 0.4827, Нижняя 0.4761; Сигнал: позиция на продажу открывается после фиксации цены ниже границы прямоугольника 0.4761.
- Все
- Все
- Bearish Rectangle
- Bearish Symmetrical Triangle
- Bearish Symmetrical Triangle
- Bullish Rectangle
- Double Top
- Double Top
- Triple Bottom
- Triple Bottom
- Triple Top
- Triple Top
- Все
- Все
- Покупка
- Продажа
- Все
- 1
- 2
- 3
- 4
- 5
Double Top
сформирован 23.06 в 10:10:53 (UTC+0)
сила сигнала 1 из 5
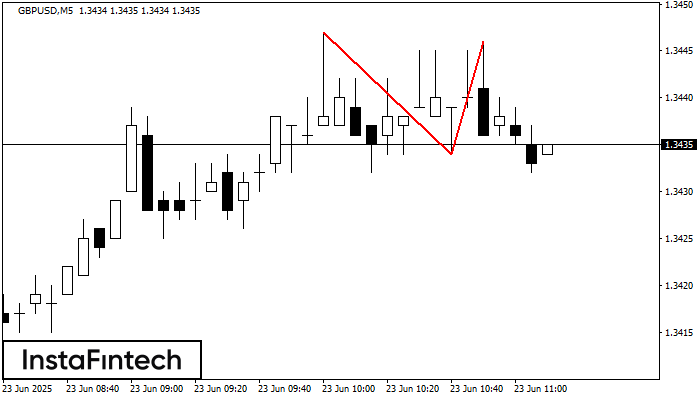
On the chart of GBPUSD M5 the Double Top reversal pattern has been formed. Characteristics: the upper boundary 1.3446; the lower boundary 1.3434; the width of the pattern 12 points
The M5 and M15 time frames may have more false entry points.
Открыть график инструмента в новом окне
Double Top
сформирован 23.06 в 09:55:33 (UTC+0)
сила сигнала 1 из 5
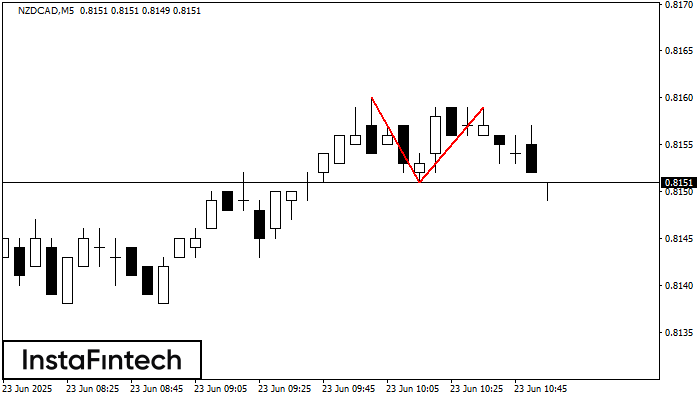
The Double Top reversal pattern has been formed on NZDCAD M5. Characteristics: the upper boundary 0.8160; the lower boundary 0.8151; the width of the pattern is 8 points. Sell trades
The M5 and M15 time frames may have more false entry points.
Открыть график инструмента в новом окне
Inverse Head and Shoulder
сформирован 23.06 в 09:25:12 (UTC+0)
сила сигнала 1 из 5
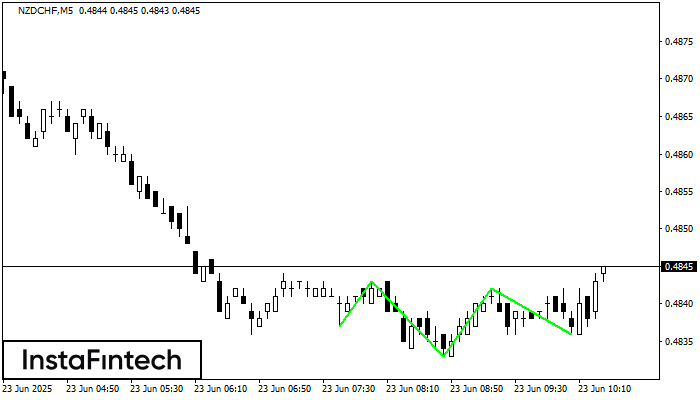
According to the chart of M5, NZDCHF produced the pattern termed the Inverse Head and Shoulder. The Head is fixed at 0.4833 while the median line of the Neck
The M5 and M15 time frames may have more false entry points.
Открыть график инструмента в новом окне


