

Dolzarb patternlar

Двойное дно
сформирован 04.04 в 10:35:13 (UTC+0)
сила сигнала 1 из 5
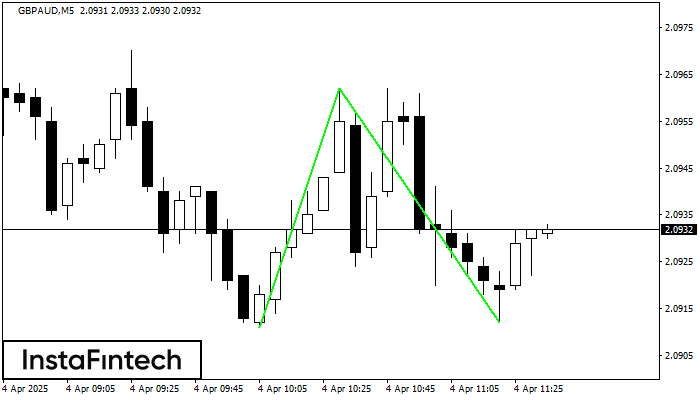
Сформирована фигура «Двойное дно» на графике GBPAUD M5. Верхняя граница 2.0962; Нижняя граница 2.0912; Ширина фигуры 51 пунктов. В случае пробоя верхней границы 2.0962 можно будет прогнозировать изменение тенденции, где ширина фигуры и будет являться расстоянием предположительного Тейк Профита.
Таймфреймы М5 и М15 могут иметь больше ложных точек входа.
- Все
- Все
- Bearish Rectangle
- Bearish Symmetrical Triangle
- Bearish Symmetrical Triangle
- Bullish Rectangle
- Double Top
- Double Top
- Triple Bottom
- Triple Bottom
- Triple Top
- Triple Top
- Все
- Все
- Покупка
- Продажа
- Все
- 1
- 2
- 3
- 4
- 5
Double Bottom
сформирован 13.06 в 13:45:32 (UTC+0)
сила сигнала 2 из 5
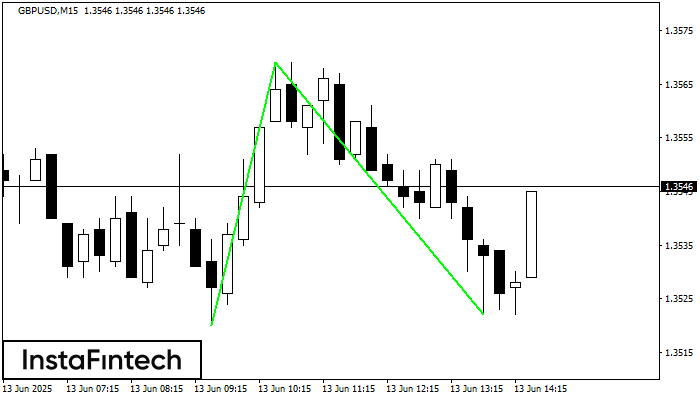
The Double Bottom pattern has been formed on GBPUSD M15. Characteristics: the support level 1.3520; the resistance level 1.3569; the width of the pattern 49 points. If the resistance level
The M5 and M15 time frames may have more false entry points.
Открыть график инструмента в новом окне
Double Top
сформирован 13.06 в 13:10:20 (UTC+0)
сила сигнала 1 из 5
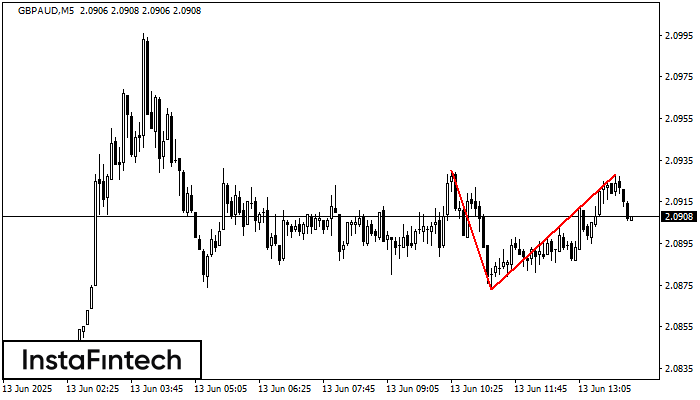
The Double Top pattern has been formed on GBPAUD M5. It signals that the trend has been changed from upwards to downwards. Probably, if the base of the pattern 2.0873
The M5 and M15 time frames may have more false entry points.
Открыть график инструмента в новом окне
Bullish Rectangle
сформирован 13.06 в 12:18:51 (UTC+0)
сила сигнала 1 из 5
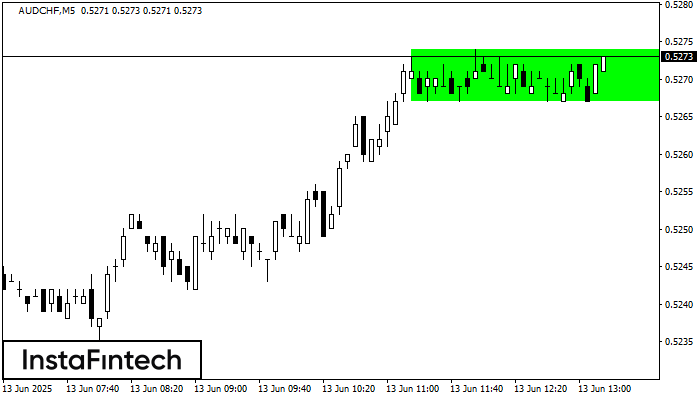
According to the chart of M5, AUDCHF formed the Bullish Rectangle. This type of a pattern indicates a trend continuation. It consists of two levels: resistance 0.5274 and support 0.5267
The M5 and M15 time frames may have more false entry points.
Открыть график инструмента в новом окне


