

Dolzarb patternlar

Двойное дно
сформирован 03.04 в 20:45:15 (UTC+0)
сила сигнала 2 из 5
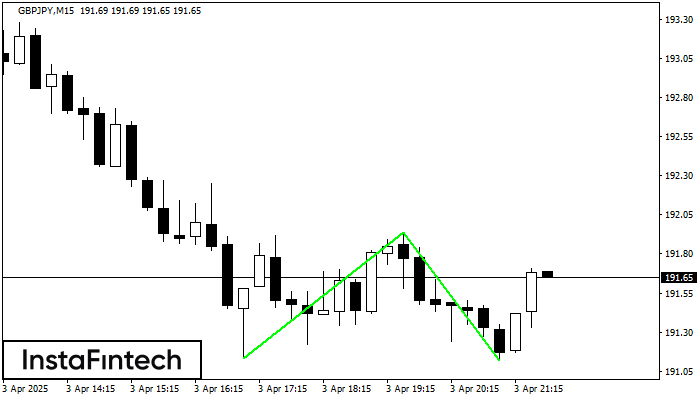
Сформирована фигура «Двойное дно» на графике GBPJPY M15. Характеристика: Уровень поддержки 191.13; Уровень сопротивления 191.94; Ширина фигуры 81 пунктов. В случае пробоя уровня сопротивления можно будет прогнозировать изменение тенденции, где первая точка фиксации прибыли находится на расстоянии 82 пунктов.
Таймфреймы М5 и М15 могут иметь больше ложных точек входа.
- Все
- Все
- Bearish Rectangle
- Bearish Symmetrical Triangle
- Bearish Symmetrical Triangle
- Bullish Rectangle
- Double Top
- Double Top
- Triple Bottom
- Triple Bottom
- Triple Top
- Triple Top
- Все
- Все
- Покупка
- Продажа
- Все
- 1
- 2
- 3
- 4
- 5
Double Bottom
was formed on 13.06 at 03:50:43 (UTC+0)
signal strength 1 of 5
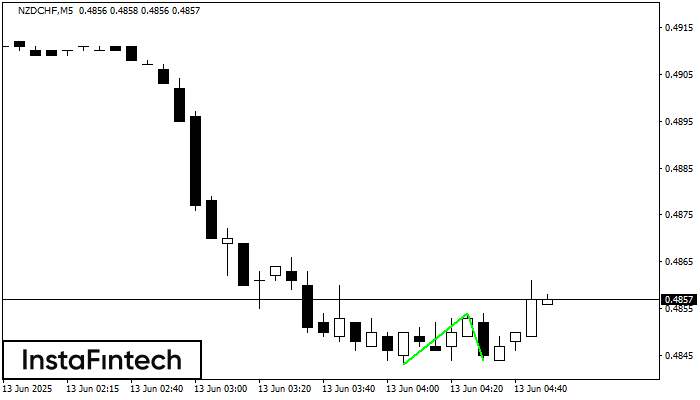
The Double Bottom pattern has been formed on NZDCHF M5; the upper boundary is 0.4854; the lower boundary is 0.4844. The width of the pattern is 11 points. In case
The M5 and M15 time frames may have more false entry points.
Open chart in a new window
Bearish pennant
was formed on 13.06 at 03:23:55 (UTC+0)
signal strength 1 of 5
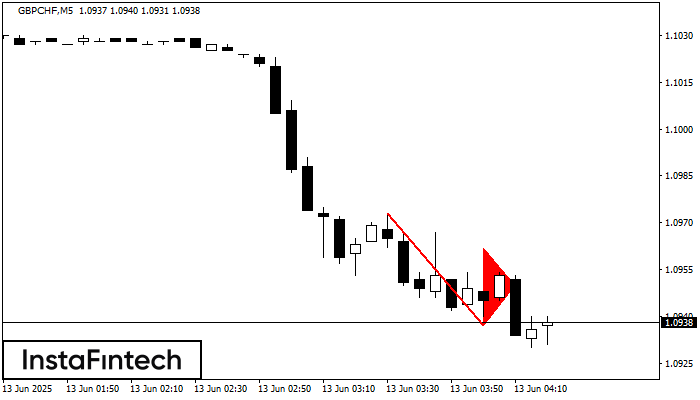
The Bearish pennant pattern has formed on the GBPCHF M5 chart. This pattern type is characterized by a slight slowdown after which the price will move in the direction
The M5 and M15 time frames may have more false entry points.
Open chart in a new window
Bearish Flag
was formed on 13.06 at 03:14:55 (UTC+0)
signal strength 1 of 5
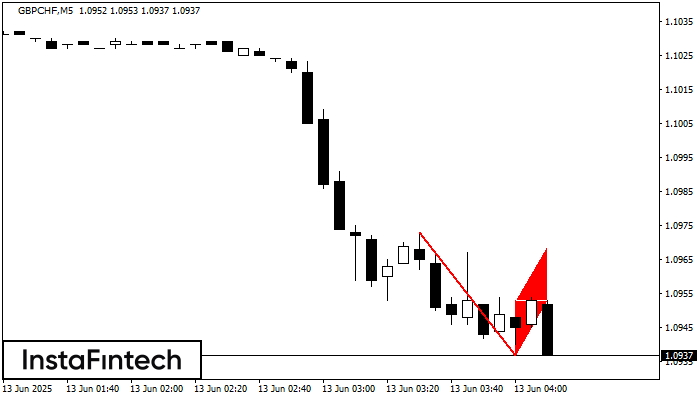
The Bearish Flag pattern has been formed on the chart GBPCHF M5. Therefore, the downwards trend is likely to continue in the nearest term. As soon as the price breaks
The M5 and M15 time frames may have more false entry points.
Open chart in a new window


