

Dolzarb patternlar

Медвежий вымпел
сформирован 03.04 в 15:29:56 (UTC+0)
сила сигнала 1 из 5
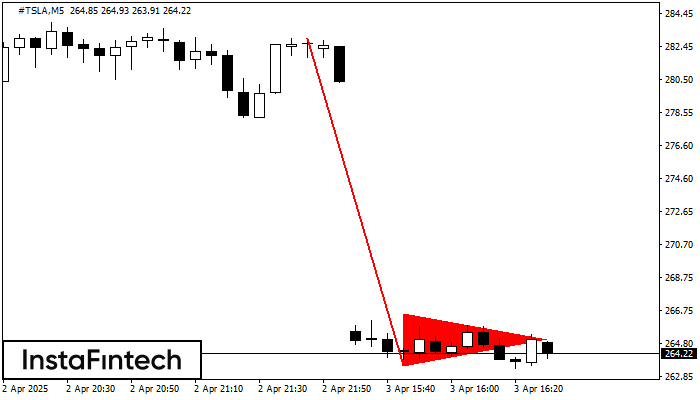
По торговому инструменту #TSLA на M5 сформировалась графическая фигура «Медвежий вымпел». Фигура данного типа характеризует небольшое замедление, после которого движение продолжится в исходном тренде. В случае если котировке удастся зафиксироваться ниже минимума образованной фигуры 263.52, трейдеру представится возможность удачно войти в позицию на продажу.
Таймфреймы М5 и М15 могут иметь больше ложных точек входа.
- Все
- Все
- Bearish Rectangle
- Bearish Symmetrical Triangle
- Bearish Symmetrical Triangle
- Bullish Rectangle
- Double Top
- Double Top
- Triple Bottom
- Triple Bottom
- Triple Top
- Triple Top
- Все
- Все
- Покупка
- Продажа
- Все
- 1
- 2
- 3
- 4
- 5
Double Top
was formed on 09.06 at 21:45:52 (UTC+0)
signal strength 1 of 5
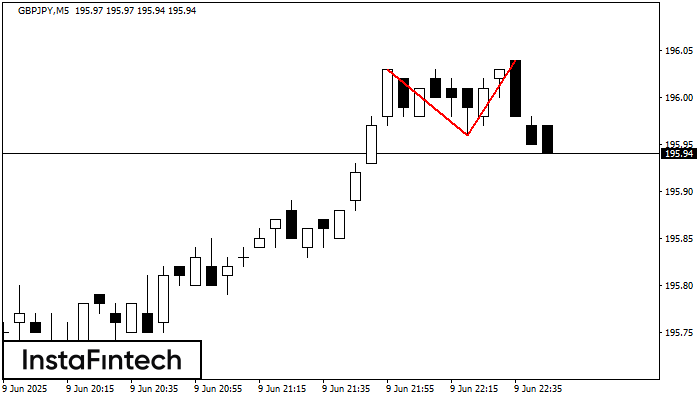
On the chart of GBPJPY M5 the Double Top reversal pattern has been formed. Characteristics: the upper boundary 196.04; the lower boundary 195.96; the width of the pattern 8 points
The M5 and M15 time frames may have more false entry points.
Open chart in a new window
Triple Top
was formed on 09.06 at 21:45:21 (UTC+0)
signal strength 2 of 5

On the chart of the NZDCHF M15 trading instrument, the Triple Top pattern that signals a trend change has formed. It is possible that after formation of the third peak
The M5 and M15 time frames may have more false entry points.
Open chart in a new window
Double Top
was formed on 09.06 at 21:45:15 (UTC+0)
signal strength 1 of 5

On the chart of EURCAD M5 the Double Top reversal pattern has been formed. Characteristics: the upper boundary 1.5639; the lower boundary 1.5628; the width of the pattern 11 points
The M5 and M15 time frames may have more false entry points.
Open chart in a new window


