

Dolzarb patternlar

Двойная вершина
сформирован 02.04 в 04:20:22 (UTC+0)
сила сигнала 1 из 5
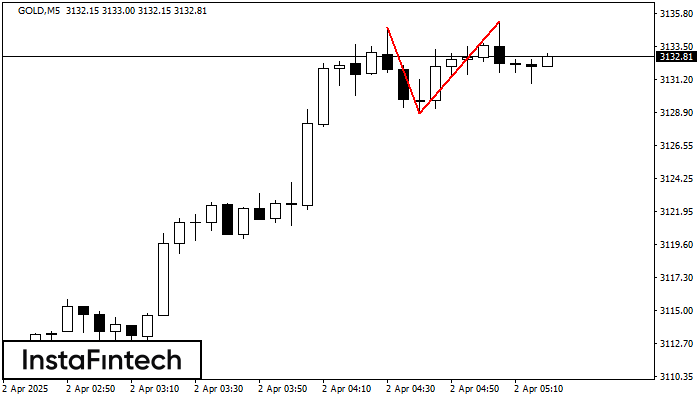
На торговом графике GOLD M5 сформировалась разворотная фигура «Двойная вершина». Характеристика: Верхняя граница 3135.25; Нижняя граница 3128.79; Ширина фигуры 646 пунктов. Сигнал: Пробой нижней границы 3128.79 приведет к дальнейшему нисходящему движению с перспективой хода к уровню 3128.64.
Таймфреймы М5 и М15 могут иметь больше ложных точек входа.
Shuningdek ko'ring
- Все
- Все
- Bearish Rectangle
- Bearish Symmetrical Triangle
- Bearish Symmetrical Triangle
- Bullish Rectangle
- Double Top
- Double Top
- Triple Bottom
- Triple Bottom
- Triple Top
- Triple Top
- Все
- Все
- Покупка
- Продажа
- Все
- 1
- 2
- 3
- 4
- 5
Bullish Rectangle
сформирован 30.05 в 06:39:56 (UTC+0)
сила сигнала 3 из 5
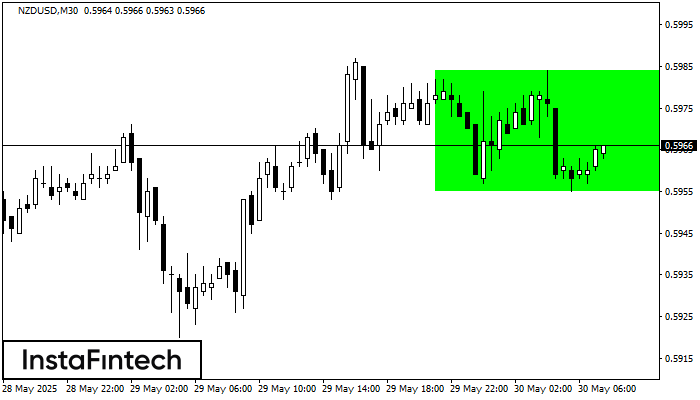
According to the chart of M30, NZDUSD formed the Bullish Rectangle which is a pattern of a trend continuation. The pattern is contained within the following borders: the lower border
Открыть график инструмента в новом окне
Bullish Rectangle
сформирован 30.05 в 06:35:20 (UTC+0)
сила сигнала 1 из 5
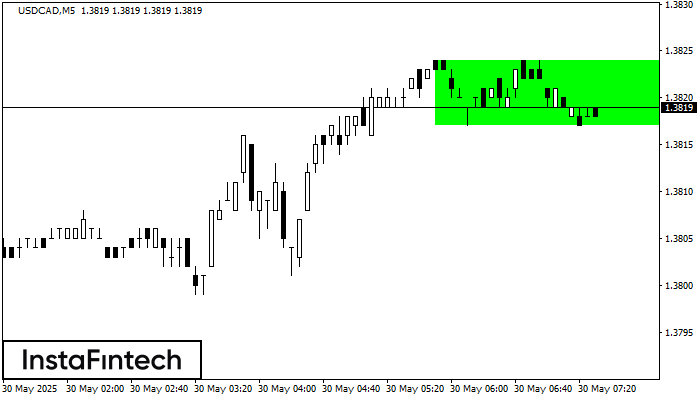
According to the chart of M5, USDCAD formed the Bullish Rectangle. This type of a pattern indicates a trend continuation. It consists of two levels: resistance 1.3824 and support 1.3817
The M5 and M15 time frames may have more false entry points.
Открыть график инструмента в новом окне
Triple Top
сформирован 30.05 в 06:20:41 (UTC+0)
сила сигнала 1 из 5
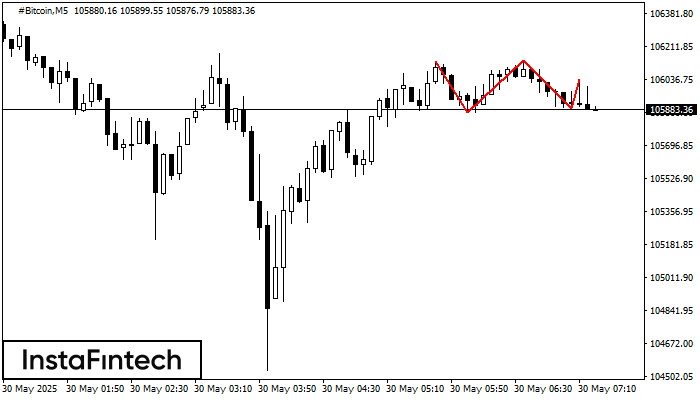
On the chart of the #Bitcoin M5 trading instrument, the Triple Top pattern that signals a trend change has formed. It is possible that after formation of the third peak
The M5 and M15 time frames may have more false entry points.
Открыть график инструмента в новом окне


