

Dolzarb patternlar

Бычий вымпел
сформирован 01.04 в 22:25:52 (UTC+0)
сила сигнала 1 из 5
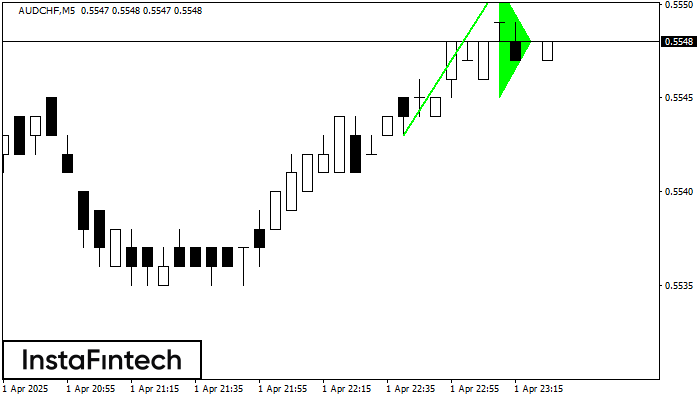
Графическая фигура «Бычий вымпел» сформировалась по инструменту AUDCHF на M5. Данный вид фигуры относится к типу продолжения тенденции. В случае если котировке удастся преодолеть максимум вымпела 0.5551, то ожидается продолжение восходящего тренда к уровню 0.5566.
Таймфреймы М5 и М15 могут иметь больше ложных точек входа.
Shuningdek ko'ring
- Все
- Все
- Bearish Rectangle
- Bearish Symmetrical Triangle
- Bearish Symmetrical Triangle
- Bullish Rectangle
- Double Top
- Double Top
- Triple Bottom
- Triple Bottom
- Triple Top
- Triple Top
- Все
- Все
- Покупка
- Продажа
- Все
- 1
- 2
- 3
- 4
- 5
Bullish Symmetrical Triangle
сформирован 12.06 в 06:45:29 (UTC+0)
сила сигнала 1 из 5
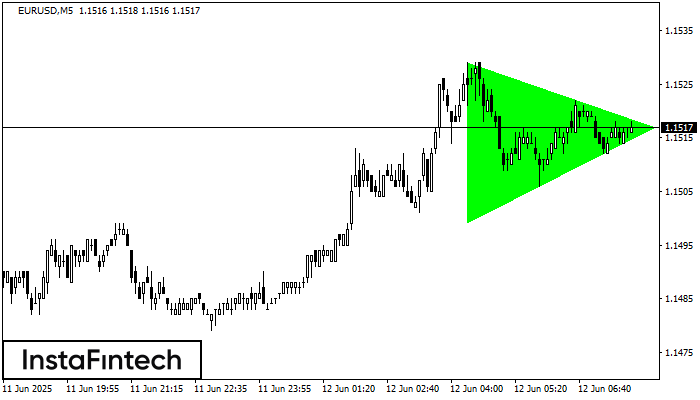
According to the chart of M5, EURUSD formed the Bullish Symmetrical Triangle pattern. The lower border of the pattern touches the coordinates 1.1499/1.1517 whereas the upper border goes across 1.1529/1.1517
The M5 and M15 time frames may have more false entry points.
Открыть график инструмента в новом окне
Bearish Symmetrical Triangle
сформирован 12.06 в 06:05:41 (UTC+0)
сила сигнала 1 из 5
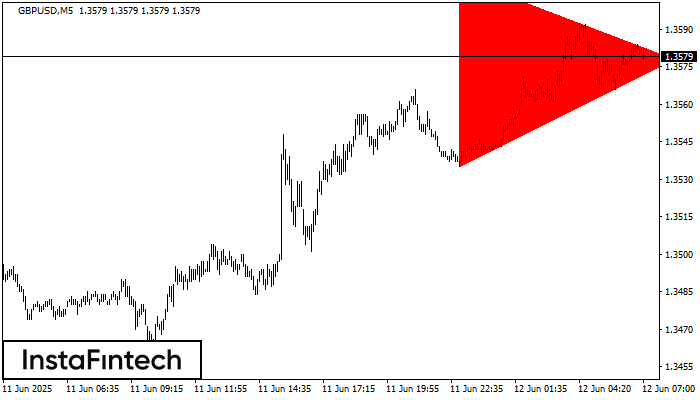
According to the chart of M5, GBPUSD formed the Bearish Symmetrical Triangle pattern. Trading recommendations: A breach of the lower border 1.3535 is likely to encourage a continuation
The M5 and M15 time frames may have more false entry points.
Открыть график инструмента в новом окне
Triple Bottom
сформирован 12.06 в 06:05:27 (UTC+0)
сила сигнала 1 из 5
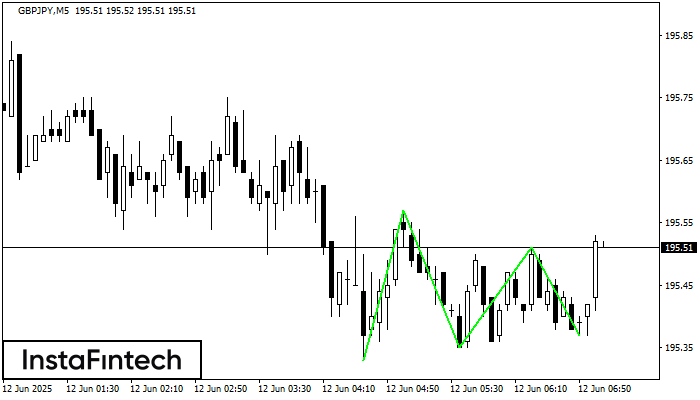
The Triple Bottom pattern has formed on the chart of GBPJPY M5. Features of the pattern: The lower line of the pattern has coordinates 195.57 with the upper limit 195.57/195.51
The M5 and M15 time frames may have more false entry points.
Открыть график инструмента в новом окне


