

Dolzarb patternlar

Медвежий симметричный треугольник
сформирован 01.04 в 05:50:43 (UTC+0)
сила сигнала 2 из 5
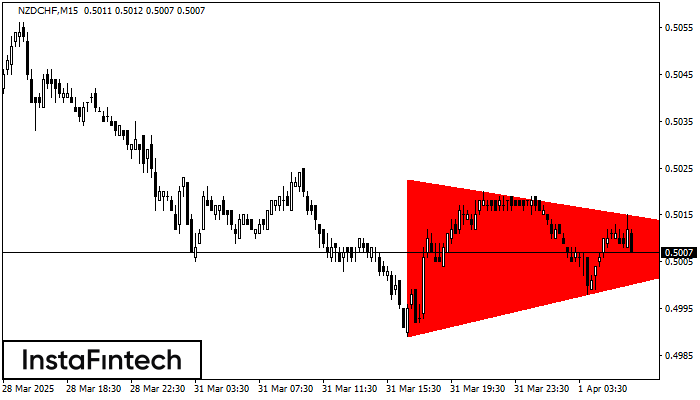
На графике NZDCHF на M15 сформировалась фигура «Медвежий симметричный треугольник». Торговые рекомендации: Пробой нижней границы 0.4989 с большой долей вероятности приведет к продолжению нисходящего тренда.
Таймфреймы М5 и М15 могут иметь больше ложных точек входа.
- Все
- Все
- Bearish Rectangle
- Bearish Symmetrical Triangle
- Bearish Symmetrical Triangle
- Bullish Rectangle
- Double Top
- Double Top
- Triple Bottom
- Triple Bottom
- Triple Top
- Triple Top
- Все
- Все
- Покупка
- Продажа
- Все
- 1
- 2
- 3
- 4
- 5
Double Bottom
сформирован 25.05 в 12:20:13 (UTC+0)
сила сигнала 1 из 5

The Double Bottom pattern has been formed on #Bitcoin M5. Characteristics: the support level 106888.42; the resistance level 107214.56; the width of the pattern 32614 points. If the resistance level
The M5 and M15 time frames may have more false entry points.
Открыть график инструмента в новом окне
Bullish Rectangle
сформирован 25.05 в 07:55:30 (UTC+0)
сила сигнала 1 из 5

According to the chart of M5, #Bitcoin formed the Bullish Rectangle which is a pattern of a trend continuation. The pattern is contained within the following borders: the lower border
The M5 and M15 time frames may have more false entry points.
Открыть график инструмента в новом окне
Bullish Symmetrical Triangle
сформирован 24.05 в 18:46:25 (UTC+0)
сила сигнала 2 из 5

According to the chart of M15, #Bitcoin formed the Bullish Symmetrical Triangle pattern, which signals the trend will continue. Description. The upper border of the pattern touches the coordinates 109440.14/108872.57
The M5 and M15 time frames may have more false entry points.
Открыть график инструмента в новом окне


