

Dolzarb patternlar

Двойная вершина
сформирован 01.04 в 00:06:09 (UTC+0)
сила сигнала 1 из 5
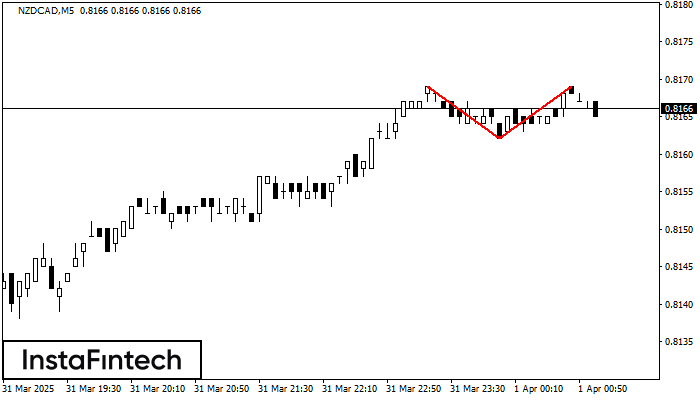
По торговому инструменту NZDCAD на M5 сформировалась фигура «Двойная вершина», которая сигнализирует нам об изменении тенденции с восходящей на нисходящую. Вероятно, что, в случае пробоя основания фигуры 0.8162, возможно дальнейшее нисходящее движение.
Таймфреймы М5 и М15 могут иметь больше ложных точек входа.
- Все
- Все
- Bearish Rectangle
- Bearish Symmetrical Triangle
- Bearish Symmetrical Triangle
- Bullish Rectangle
- Double Top
- Double Top
- Triple Bottom
- Triple Bottom
- Triple Top
- Triple Top
- Все
- Все
- Покупка
- Продажа
- Все
- 1
- 2
- 3
- 4
- 5
Inverse Head and Shoulder
сформирован 11.06 в 05:40:20 (UTC+0)
сила сигнала 1 из 5
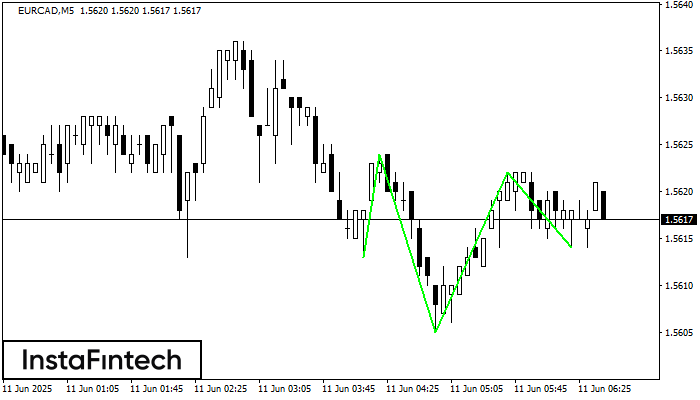
According to the chart of M5, EURCAD formed the Inverse Head and Shoulder pattern. The Head’s top is set at 1.5622 while the median line of the Neck is found
The M5 and M15 time frames may have more false entry points.
Открыть график инструмента в новом окне
Bearish Rectangle
сформирован 11.06 в 05:40:01 (UTC+0)
сила сигнала 1 из 5
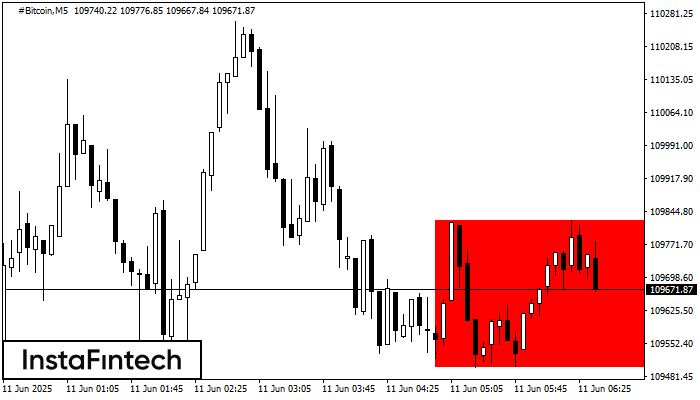
According to the chart of M5, #Bitcoin formed the Bearish Rectangle which is a pattern of a trend continuation. The pattern is contained within the following borders: lower border 109500.22
The M5 and M15 time frames may have more false entry points.
Открыть график инструмента в новом окне
Triple Bottom
сформирован 11.06 в 05:00:31 (UTC+0)
сила сигнала 1 из 5
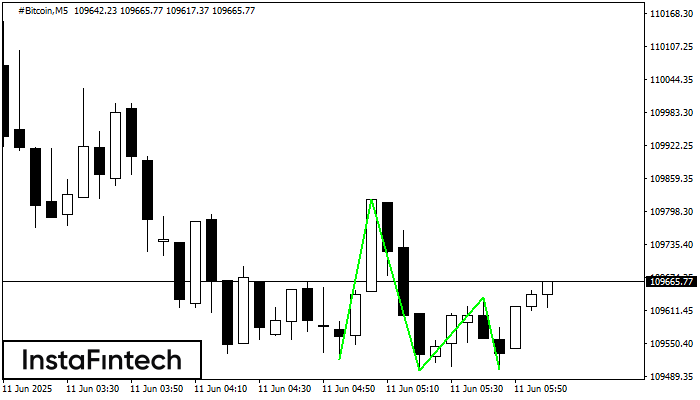
The Triple Bottom pattern has been formed on #Bitcoin M5. It has the following characteristics: resistance level 109821.12/109636.18; support level 109521.27/109502.23; the width is 29985 points. In the event
The M5 and M15 time frames may have more false entry points.
Открыть график инструмента в новом окне


