

Dolzarb patternlar

Тройное дно
сформирован 31.03 в 23:06:34 (UTC+0)
сила сигнала 1 из 5
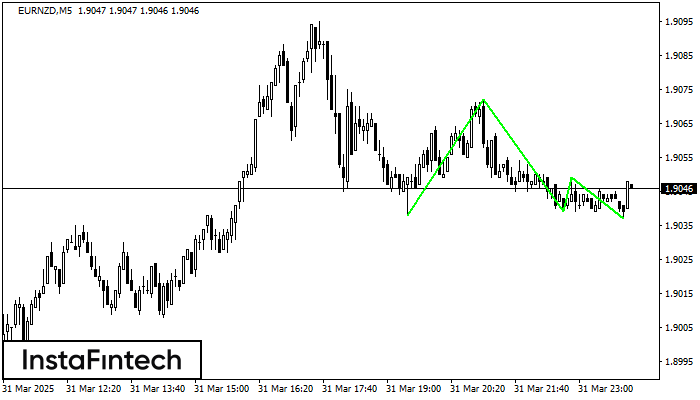
По торговому инструменту EURNZD на M5 была сформирована графическая фигура «Тройное дно» с характеристиками: Уровень сопротивления 1.9049; Уровень поддержки 1.9037; Ширина 12 пунктов. В случае пробоя уровня сопротивления 1.9072 котировка, скорее всего, продолжит восходящее движение как минимум на 33 пунктов.
Таймфреймы М5 и М15 могут иметь больше ложных точек входа.
Shuningdek ko'ring
- Все
- Все
- Bearish Rectangle
- Bearish Symmetrical Triangle
- Bearish Symmetrical Triangle
- Bullish Rectangle
- Double Top
- Double Top
- Triple Bottom
- Triple Bottom
- Triple Top
- Triple Top
- Все
- Все
- Покупка
- Продажа
- Все
- 1
- 2
- 3
- 4
- 5
Bullish Symmetrical Triangle
was formed on 16.04 at 11:55:29 (UTC+0)
signal strength 1 of 5
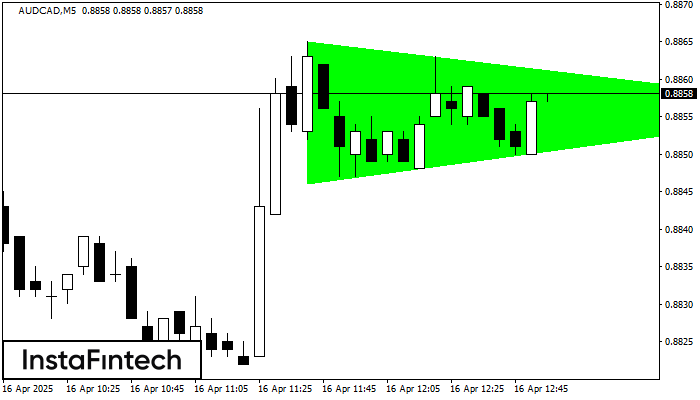
According to the chart of M5, AUDCAD formed the Bullish Symmetrical Triangle pattern, which signals the trend will continue. Description. The upper border of the pattern touches the coordinates 0.8865/0.8856
The M5 and M15 time frames may have more false entry points.
Open chart in a new window
Double Bottom
was formed on 16.04 at 11:45:26 (UTC+0)
signal strength 1 of 5
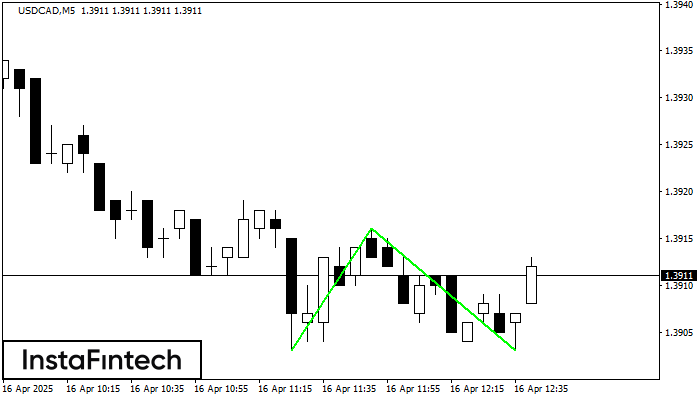
The Double Bottom pattern has been formed on USDCAD M5; the upper boundary is 1.3916; the lower boundary is 1.3903. The width of the pattern is 13 points. In case
The M5 and M15 time frames may have more false entry points.
Open chart in a new window
Double Bottom
was formed on 16.04 at 11:00:11 (UTC+0)
signal strength 3 of 5
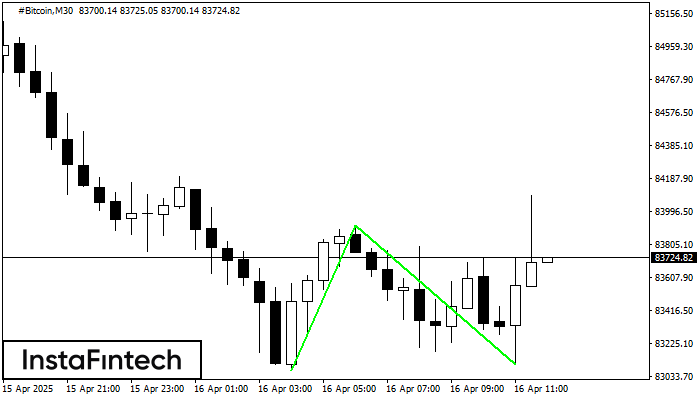
The Double Bottom pattern has been formed on #Bitcoin M30; the upper boundary is 83915.56; the lower boundary is 83100.24. The width of the pattern is 84817 points. In case
Open chart in a new window


